
After losing 1,400 points on the Dow last week, I’m sure there’s a sense of relief on Wall Street given the tremendous rally Tuesday. Now, if only the major averages can find some semblance of a follow through on Wednesday, investors might be able to avoid the dreaded “double dip”. On Tuesday, the major averages bounced higher on light volume, but bounced higher nonetheless. The Dow finished the trading session near the highs of the day, up 547 points or 2.17 percent. The S&P finished higher by 2.15% with the Nasdaq and Russell 2000 both finishing higher by 2.8 % on the day. It was quite the rebound and coincided with stronger than anticipated economic data.
The National Association of Home Builders’ monthly confidence index rose 1 point to 68 in October. The tracker of sentiment among residential construction firms beat the Econoday consensus forecast of a flat reading.
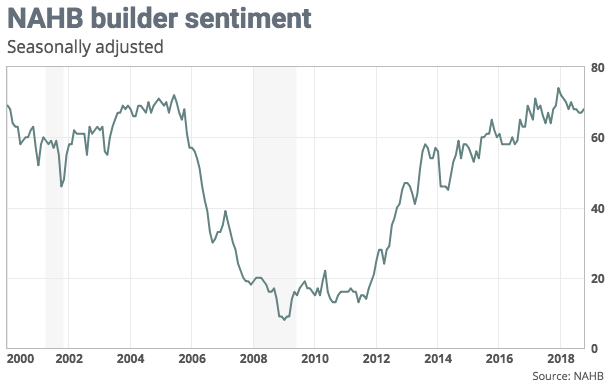
Current sales conditions were at 74 in October, and expectations for sales over the next six months were 75. The gauge of buyer traffic surged four points to 53. “Builders are motivated by solid housing demand, fueled by a growing economy and a generational low for unemployment,” the industry group said.
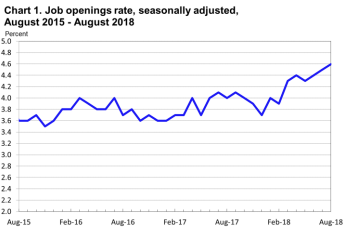
On top of the better than expected Housing sentiment reading, job openings hit a record level high in August, according to the Labor Department. The Job Openings and Labor Turnover Survey showed that vacancies level hit 7.14 million for the month. The total number of hires also reached a record of 5.78 million.
“The fact that record numbers of workers are voluntarily quitting their jobs suggests that they are finding substantially better opportunities elsewhere in the economy,” said Julia Pollak, labor economist at online employment marketplace ZipRecruiter.”
Although the economic data continues to come in strong and demonstrate the strength of the economy, there might be more pain ahead for investors according to famed volatility expert Mark Sebastian. Sebastian the founder of OptionPit.com, and Jim Cramer’s colleague at RealMoney.com and “Mad Money’s” resident VIX expert recently suggested that the market may take another leg lower before finding higher highs.
“While Tuesday’s up action looks fabulous, Sebastian points out that it doesn’t mean the pain is over,” the “Mad Money” host said. “Today, we’re melting up. Sebastian thinks that the volatility index has peaked for the moment, but as we saw in February and the summer of 2015, the day where the VIX peaks is not necessarily the day where the S&P 500 bottoms.”
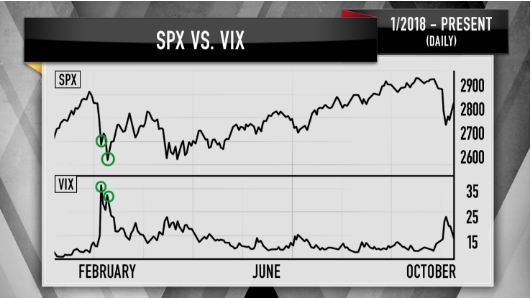
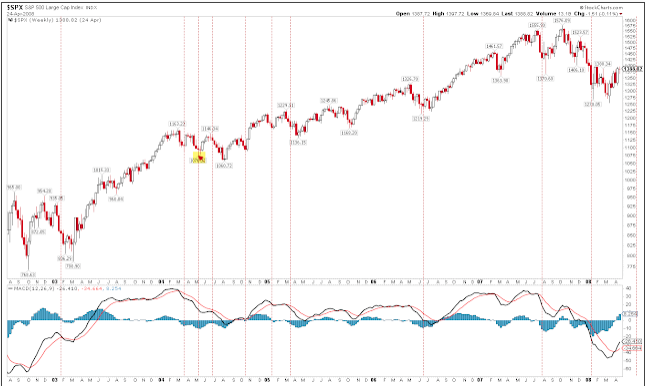
As shown in the chart above from the market correction back in February, the VIX peaked well before the S&P 500 bottomed. Sebastian sees a lot of similarities today with the February collapse.
“That’s why Sebastian believes there’s a strong chance that this market will retest last week’s lows, probably go lower, even,” Cramer continued.
While the charts and Sebastian’s expertise are undeniable, Cramer concluded the segment on Mad Money by saying that Tuesday’s rally seemed rather convincing.
As it pertains to the VIX complex itself, VIX Futures (M1) expired last night with back dated contracts rolling forward. Term Structure remains in a state of slight backwardation, although curtailed greatly. In a recent interview, Finom Group’s Seth Golden discusses trading volatility through good times and bad times in the market.
Mark Sebastian isn’t the only one who thinks there is going to be more pain to come. One of the bigger bears on Wall Street, Michael Wilson of Morgan Stanley also believes there is more pain to be expressed in the market soon enough. Wilson explains that the market pullback is a process and unless rates go down, the market has peaked. Quantitative tightening accelerating, ECB tapering and this being a blackout period for buybacks has created a liquidity crunch which could result in more market pain, Wilson offered. Having said that, Wilson suggests that quarterly earnings season should be fine although he expressed concerns about margins out in 2019. Lastly, Wilson says the potential for the market pullback exists for the S&P 500 to retrench all the way down to 2,600-2,650.
Given the stated bearish opinions near term for the market, let’s look at a more optimistic opinion of near term direction. Goldman Sachs strategist David Kostin thinks the worst of it already may have passed.
“We see limited further downside. Despite the recent sell-off, equity fundamentals are strong and we remain constructive on the path of the S&P 500. Such declines are normal and shouldn’t have longer-lasting effects. The S&P 500 historically has seen 5 percent drawdowns every 71 trading days, and it had been 69 since the last one.”
Goldman’s year-end price target for the S&P 500 is 2,850, which looked pessimistic when the market was breaking records, but now points to 3% upside from last week’s close.
It might seem as though market volatility has increased in 2018 and we would offer that is the case. After a malaise had fallen over the markets in 2017, an increasing in volatility was inevitable. As the economic expansion becomes long in the tooth and interest rates rise, market anxiety tends to increase. Pravit Chintawongvanich, equity derivatives strategist at Wells Fargo Securities offered the following chart in a research note regarding market volatility.
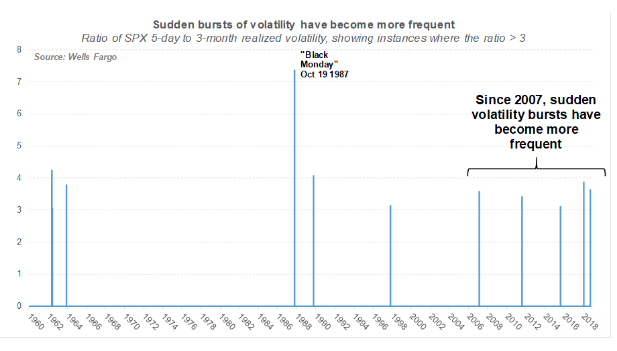
The graphic looks at days when the ratio of 5-day to 3-month realized volatility exceeded 3. “In other words, days when there is a huge burst of volatility compared with what’s been the norm,” Chintawongvanich wrote. Since 2007, there have been six such events versus only five in the preceding 50 years. In fact, a 22-year stretch from 1964 to 1986 didn’t see a single one, he noted.
Chintawongvanich explains why he thinks such volatility events tend to mark a bottom or at least a near-bottom. He concludes that, most likely, it’s because the downdrafts are more about liquidity and the temporary lack thereof rather than any sudden change in market fundamentals. Michael Wilson identified the very same liquidity factor in his near term outlook for equities.
“It’s possible that market structure has changed. That could come from the demand side, via increasing use of options and related products and strategies, or on the demand side from the rise of high-frequency trading and other developments.”
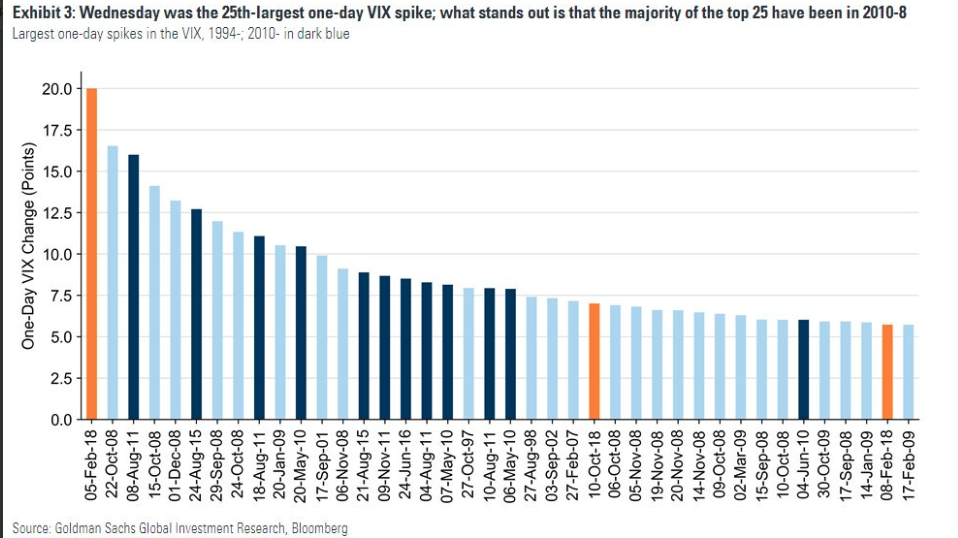
Goldman Sachs put out a similar not to Chintawongvanich’s. Goldman identified the 25 largest VIX single day moves, 13 of the 25 have been since 2010. (See chart below)
We’ve been somewhat cautious about putting more capital to work during this earnings season that began with a rather strong market pullback last week. We’ve yet to retest the bottom and that is typically what occurs. While some market strategist are denoting that a retest is likely, they are not alone in doing so. The statistics are on their side. The chart below identifies that retests are almost a certainty.
The S&P 500 has actually fallen 3 weeks in a row and for the first time since June 2016. Since 2003, SPX has fallen 3 weeks in a row more than 20 times, and all eventually retested or exceeded the low, at least intra-week. This almost always occurs within the next 3 weeks but in 2004 and 2015 it took 6-7 weeks to occur (highlighted in yellow).
While the data is undeniable, our outlook for the market remains positive long-term. The economic data continues to suggest the expansion cycle will carry into 2019 and the Q3 earnings period is shaping up to be another strong one. Furthermore, just as the statistics show a likelihood of retesting recent market lows, the statistics suggest new market highs are on their way.
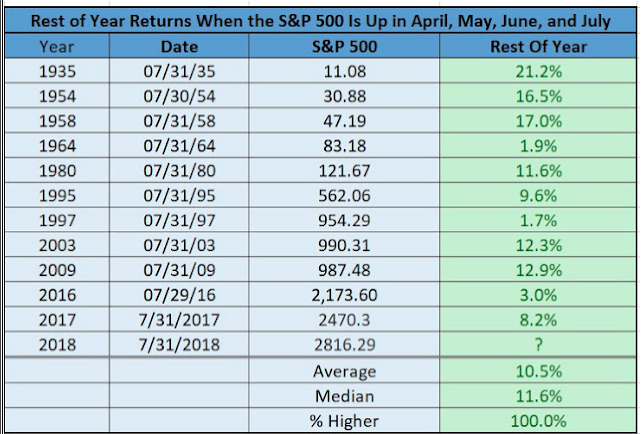
The S&P 500 closed higher in April, May, June, and July. In the 11 times this has happened since 1935, the index closed higher 5 months later (i.e., at year -end) every time by median of 12%, according to LPL Financial. For reference, the July close was 2816, 2.2% higher from Monday’s close (from Ryan Detrick).
As we kick-off the pre-market trade on Wednesday and post strong earnings from Netflix (NFLX) last night, equities are looking at a softer open on Wall Street, all but the tech-heavy Nasdaq that is. Investors are likely cautious ahead of the Housing Starts data and the release of the FOMC minutes at 2:00 p.m. EST.


