In our daily market dispatch article on Tuesday, Finom Group recognized weakness underneath the hood of the major averages, notably the S&P 500 (SPX) and Nasdaq (NDX). While the major averages once again reached record-level highs intraday, market breadth did not perform in kind. Recall from Tuesday’s article the following:
This is something we think bears attention going forward. Something is obviously brewing beneath the surface of the Nasdaq.
(Click on image to enlarge)

“Outside of the Nasdaq, the S&P 500 and NYSE are both showing signs of weakening underneath the hoods. As shown in the charts below, the S&P 500 is at new highs, but less stocks are rebounding above their moving averages.”
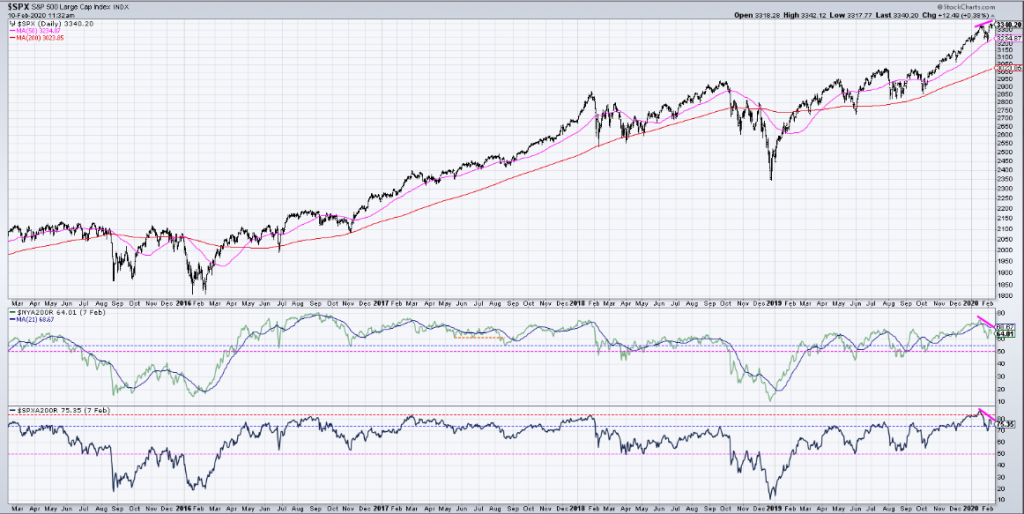
“Both the NYSE and S&P 500 Advance/Decline lines have weakened while the S&P 500 hits new record highs. One thing we don’t want to dismiss is that while the divergences are noted in the bottom two boxes and outlined in the Nasdaq, divergences do not translate to “sell signals”. Just because divergences are presented in these varied breadth indicators, the weakening is still in keeping with strong overall breadth levels. We would need to see breadth weaken further to suggest a sell signal.”
The last sentence there is a crucial distinction in highlighting that the existing breadth weakness in and of itself was not a sell signal, but simply something to pay attention to. The weakness underneath “the hood” of the major averages did play a role in Tuesday’s market retracement from all-time highs intraday.
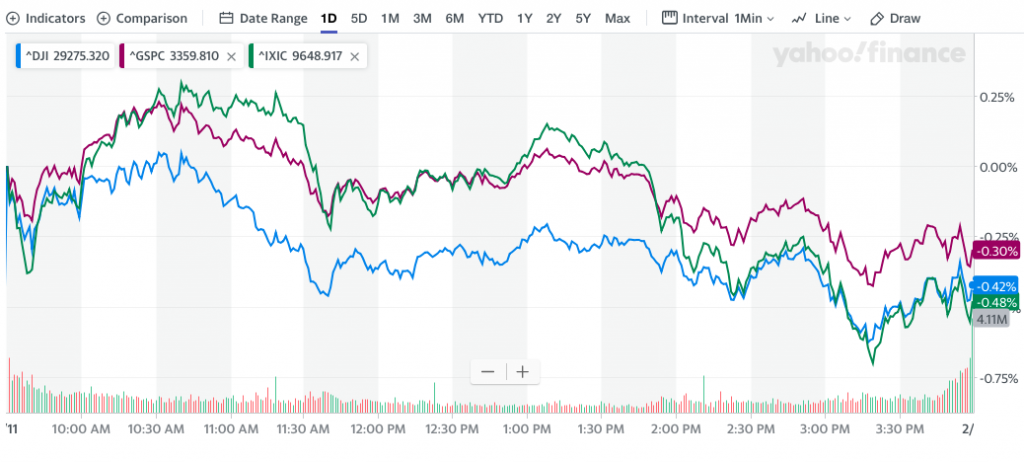
All three major averages had been up sharply on the day, especially the Nasdaq, but had outside reversals into negative territory and before rebounding in the final 15 minutes of the trading day. It’s this type of intraday reversal that identifies true weakness or correcting is afoot. We assert that the mega-cap names continue to hold up the major averages, which may only prove to solidify a topping formation near-term.
In keeping a watchful eye on market breadth/internals, we can see that breadth continued to weaken further on Tuesday, suggesting the markets nearly 4-month long rally may be culminating shortly and for the time being. Again, this is not to suggest a sell signal is being offered, but rather an opportunity to review one’s game plan for potential rebalancing opportunities.
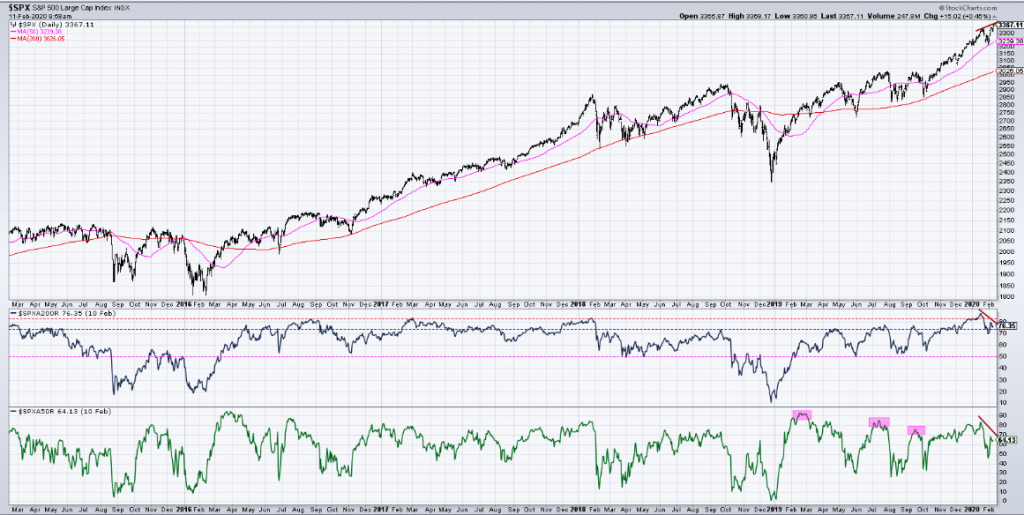
The charts above depict the S&P 500 (top) and accompanied by it’s 20 and 50-DMA average charts below. As we can see, fewer and fewer S&P 500 stocks are holding above these respective moving averages, insisting that market breadth is weakening, diverging from the benchmark index and as it continues higher. Again, while the divergence is easy to spot, the total number of stocks holding above these moving averages is still healthy, but demands a watchful eye going forward.
While the markets had a brief drawdown recently, some 3%, the distribution phase took its biggest toll on sentiment, rather than price. The CBOE options equity put/call ratio offered some sentimental relief for equity markets. But since rising sharply off of extreme lows, the put/call ratio is once again below critical levels that often coincide with a corrective phase.
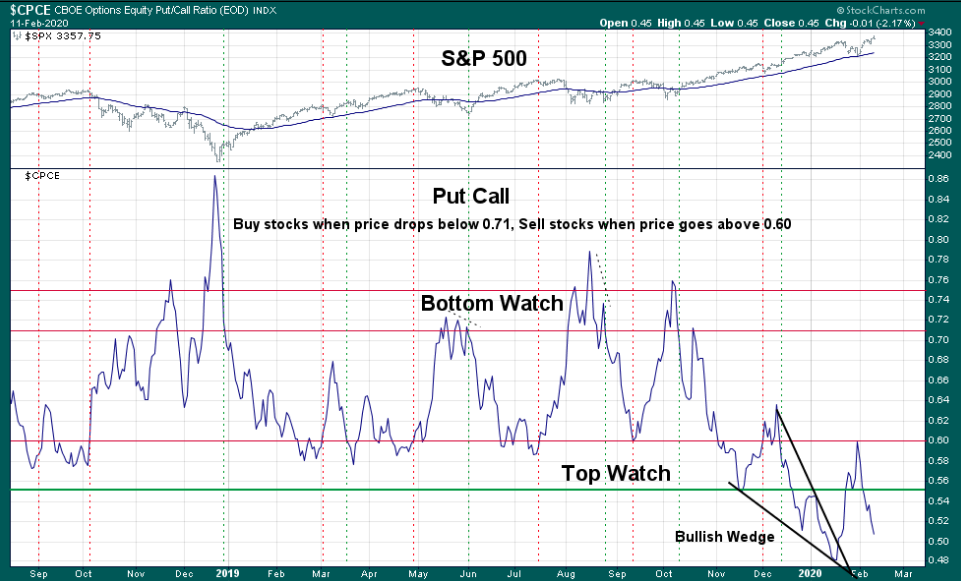
All we are basically saying is that the market doesn’t often give investors a second chance to rebalance their portfolio. Nonetheless, the trend is your friend intermittent market pullbacks, should they come to pass, would prove a healthy aspect of market performance.
Tuesday’s market activity took somewhat of a backseat to that of the Fed chairman’s bi-annual testimony before Congress. In the broadest terms, chairman Powell suggested that risks to the U.S. economy remain, particularly from the coronavirus.
“We are closely monitoring the emergence of the coronavirus, which could lead to disruptions in China that spill over to the rest of the global economy.”

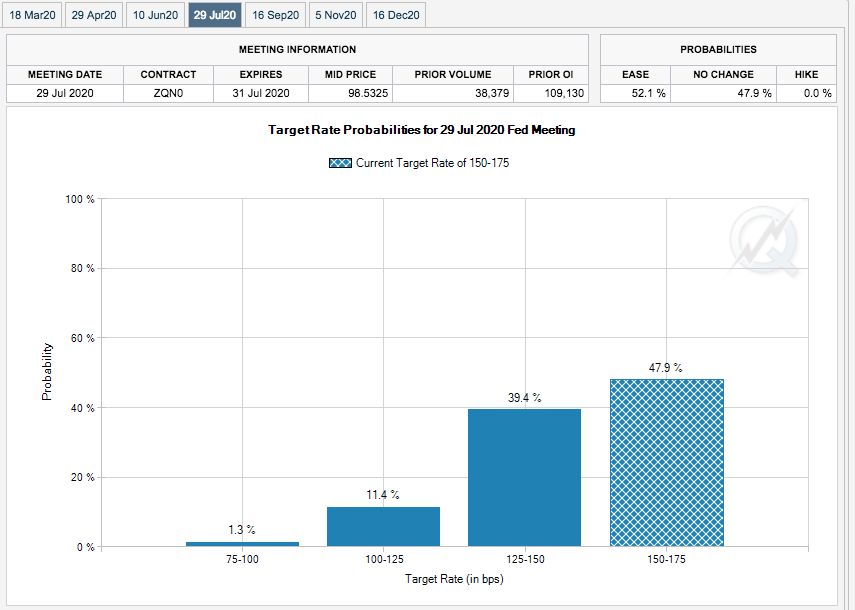
Roberto Perli, a former Fed staffer and now a fellow at Cornerstone Macro, said Powell’s language about monitoring the coronavirus significantly lowers the bar for a rate cut.
Financial markets are increasingly pricing in a Fed rate cut for July, according to the CME Group’s FedWatch tool. Other economists think the Fed will remain on hold throughout 2020. This is a very fluid dynamic presently and will shift daily.
In addition to the noted risks to the economy noted by chairman Powell, he also recognized that consumer spending moderated toward the end of the year, but suggested that “fundamentals supporting household spending remain solid.”
One of the ways we can validate the chairman’s comments was delivered through the latest New York Federal Reserve banks Q4 2019 Household Debt and Credit report. Within the report, the headline depicts that household debt jumped the most in 12 years, during the Q4 period. As we always say, however; it’s not the size of the debt, it’s the serviceability of that debt.
Total household debt balances rose by $601 billion last year, topping $14 trillion for the first time. The last time the growth was that large was 2007, when household debt rose by just over $1 trillion. Fed economists said on the Liberty Street Economics blog that the growth was driven mainly by a large increase in mortgage debt balances, which rose $433 billion and was also the largest gain since 2007. Housing debt now accounts for $9.95 billion of the total balance.
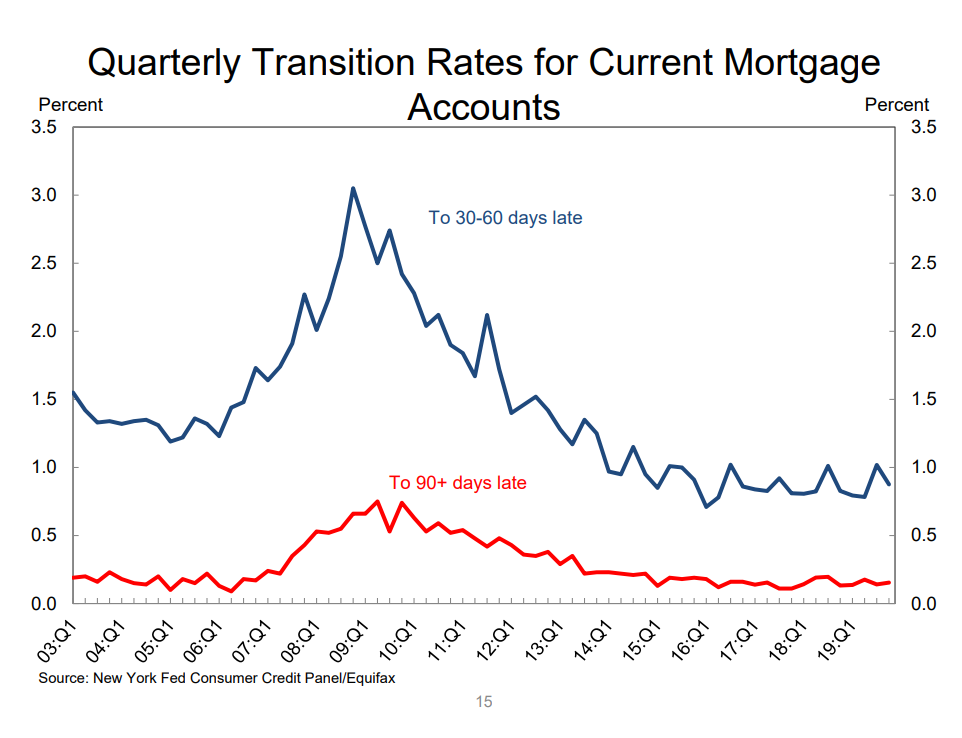
As mentioned previously, the size of the debt is not as relevant as the serviceability of that date. For this point of emphasis we can validate the Fed chairman’s comments on the health of the consumer and consumer spending when we look at delinquency rates from accrued debt. About 1.0% of current mortgage balances became 30 or more days delinquent in Q4 2019, near the lowest level observed in the data history.
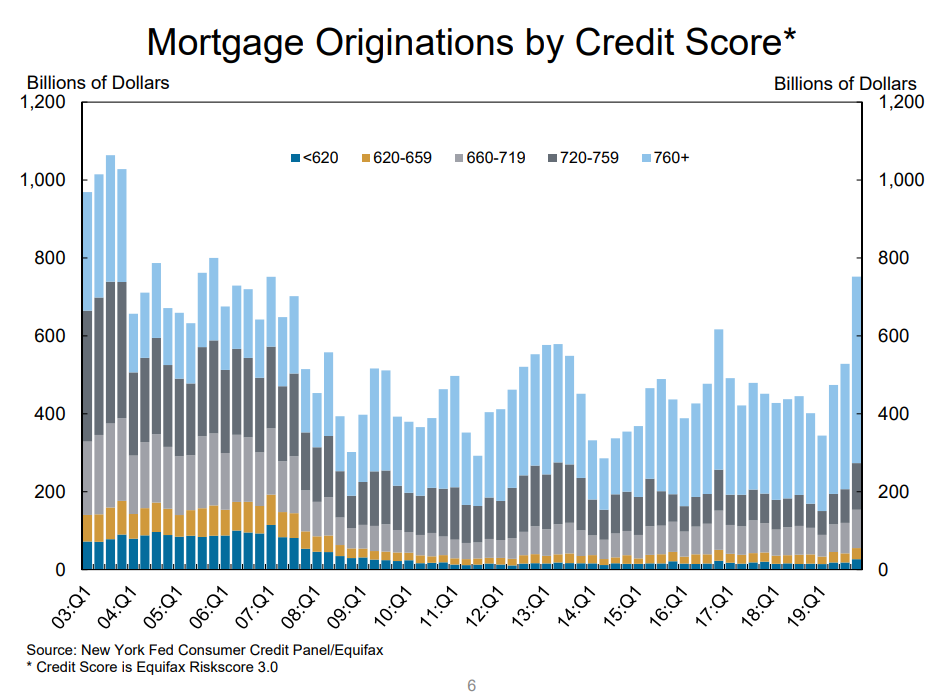
Mortgage applications hit a record level for the expansion cycle in Q4 2019. Mortgage originations were driven by borrowers with a very healthy credit history, according to the Fed’s data.
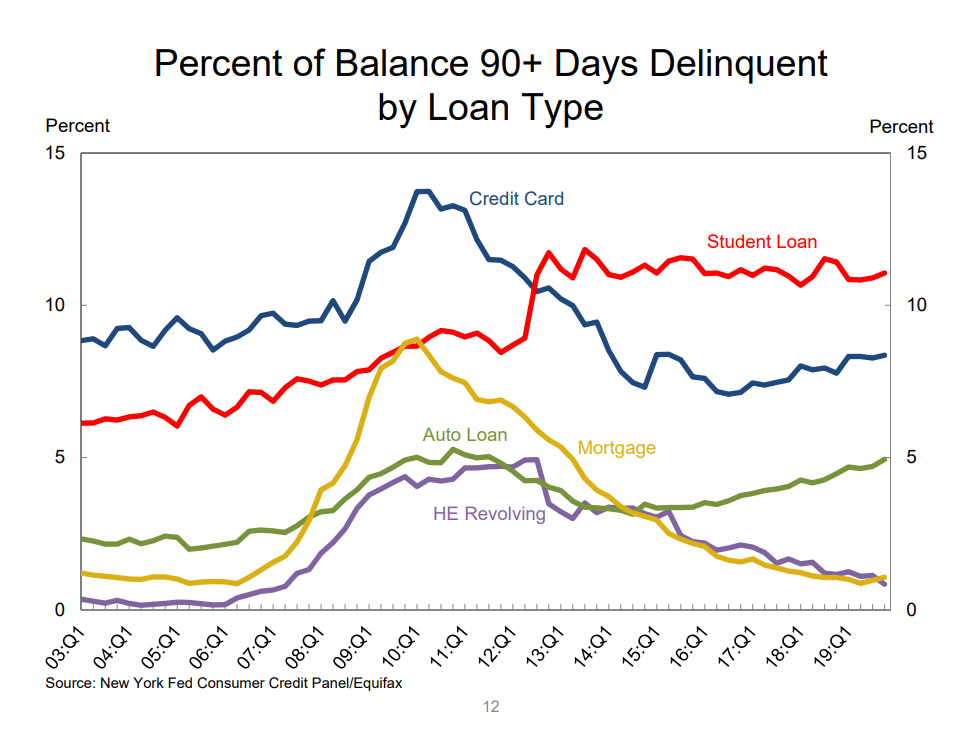
And when we look at the percent of debt balance by category 90+ days delinquent, we can make a few more comments on the household debt burden. As recognized in the chart below, credit card delinquency has been rising alongside auto loan delinquency rates. However, this is less concerning given consumer demographics and where the greatest household debt is found in housing debt. The delinquency rate for mortgage loans on one-to-four unit residential properties decreased to a seasonally adjusted rate of 3.77 percent of all loans outstanding at the end of the fourth quarter of 2019, according to the Mortgage Bankers Association’s (MBA) National Delinquency Survey.
The delinquency rate was down 20 basis points from the third quarter of 2019 and 29 basis points from one year ago. The percentage of loans on which foreclosure actions were started in the fourth quarter remained unchanged at 0.21 percent.
“The mortgage delinquency rate in the final three months of 2019 fell to its lowest level since the current survey series began in 1979,” said Marina Walsh, MBA’s Vice President of Industry Analysis. “Mortgage delinquencies track closely to the U.S. unemployment rate, and with unemployment at historic lows, it’s no surprise to see so many households paying their mortgage on time.”
In addition to the statistics surrounding mortgage debt and delinquencies, student loan debt has remained very constant since 2012, despite the headlines suggesting that student loan debt is “out of control”.
All and all, we believe that the latest data from the New York Fed is consistent with strong levels of discretionary spending. Finom Group has offered in the past and reiterates today that the most important chart for economic activity does not presently reside within jobless claims, retail sales or the ISM manufacturing index, but rather the following chart of household debt service vs. disposable personal income.
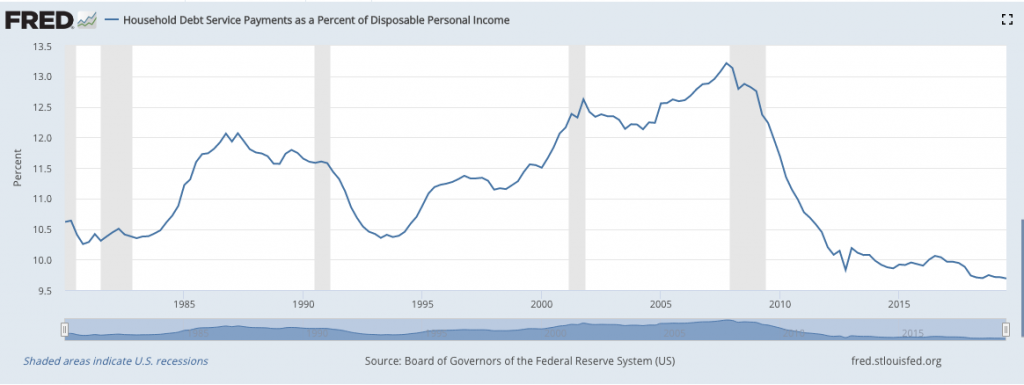
At no point since the 1970s has the U.S. household had less debt to service and more disposable income. While fears of the Coronavirus’ impact on the global and domestic economies remain, any near-term affects on the consumer are likely temporary. Household balance sheets can more than weather any short-lived affects from economic weakness.
With a light economic data calendar for the week, any weakness in the data which is delivered will drive headlines as the market trends higher and seemingly defies rationale. The latest JOLTS survey proved to be such a weak data point for the month of December, as reported on Tuesday.
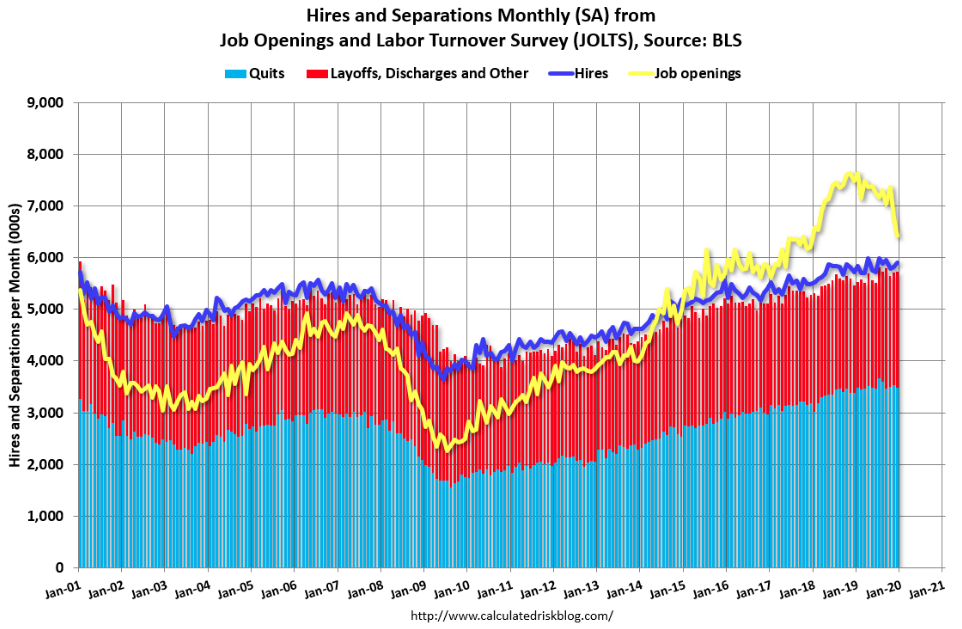
The number of job openings fell to 6.4 million (-364,000) on the last business day of December, the U.S. Bureau of Labor Statistics reported today. This now represents the lowest level of vacancies in roughly 2 years. Total vacancies now at 6.4 million, down from nearly 6.8 million in November. The total vacancies outnumber job seekers by nearly 700,000, down nearly by half from a few months ago.
Over the month, hires and separations were little changed at 5.9 million and 5.7 million, respectively. Within separations, the quits rate and layoffs and discharges rate were unchanged at 2.3% and 1.2% respectively. The number of quits was little changed in December at 3.5 million and the rate was unchanged at 2.3 percent. Quits decreased in retail trade (-111,000) and arts, entertainment, and recreation (-20,000).
On the surface, the large decline in job openings/vacancies seems to display weakness in the labor market. A closer look reveals that the number of job openings is simply normalizing. Openings were way stronger than the other components (hires and quits) in 2018 and now they are overshooting on the way down, normalizing. (See chart below)
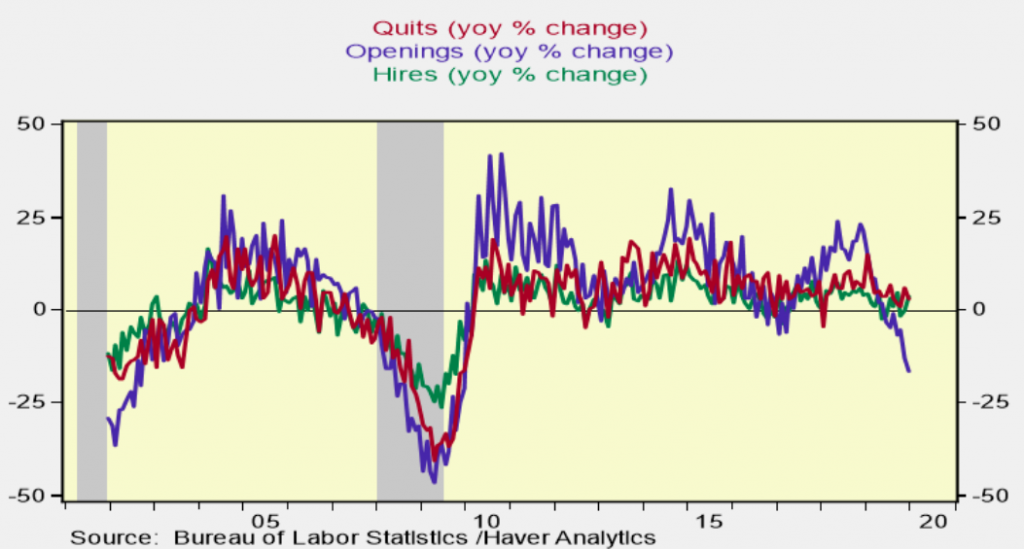
“It is possible the decline in job openings represents in part better job matching (greater willingness of employers to hire and train workers) rather than a cautionary signal .. but these data should be watched closely in upcoming months.” – RDQ Economics
There is no relevant economic data releases in the U.S. today, shy of mortgage application data due out ahead of the opening bell, but this will not prove market-moving data. For Wednesday, investors will remained focus on earnings season and the Fed chairman’s 2nd day of testimony. It’s unlikely any material shift in the chairman’s outlook will be offered and as such traders will be watching market action as new highs and stretched valuations bear greater attention.
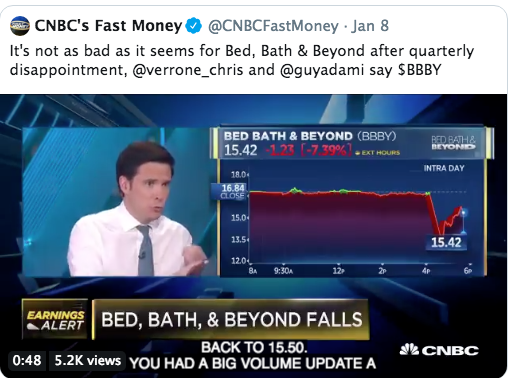
After the closing bell on Tuesday, we saw earnings warnings and guidance from Bed Bath & Beyond (BBBY) plunge the stock by more than 20% in after hours trading. The headlines from the home goods retailer are as follows:
- Comparable sales fell 5.4% during the quarter vs. -1.5% consensus, driven primarily by store traffic declines combined with inventory management issues, and increased promotional activity and markdowns.
- CEO update: “We are experiencing short-term pain in our efforts to stabilize the business, including the pressures of store traffic trends coupled with our own executional challenges. However, we did achieve a notable positive shift in sales in our digital channels during this period, with growth of approximately 20%.”
- Product availability leading into the holiday period was also a contributing factor, as inventory within certain key categories in the Bed Bath & Beyond assortment was too low or out-of-stock during the period. The Company is immediately reforming its internal planning and inventory management procedures to master the fundamentals.
It gets worse, much worse folks! The sales decline during the quarter in question reflect a low-double-digit percentage decrease in transactions in stores, partially offset by a mid-single-digit percentage increase in the average transaction amount. On a directional basis, comparable sales from stores declined nearly 11%, while comparable sales from digital channels grew approximately 20 percent. Adjusting for the calendar shift to exclude Cyber Monday week in both periods, comparable sales for the first two months of the fiscal 2019 fourth quarter declined 13%. Some 92% of Bed Bath & Beyond sales come from inside the store, not online.
Recall that after Bed Bath & Beyond reported its Q3 2019 results, Jim Cramer and the CNBC Fast Money Crew were suggesting that BBBY shares were a “buy” given the insertion of the new CEO Mark Tritton, formerly of Target Corp. (TGT).

“…hold your nose and buy” the stock.
“Bed Bath & Beyond had a terrible quarter, but it’s a new CEO and he’s already made some bold moves to turn things around. Many of those initiatives are already working, despite the stock price decline.
This quarter was the last gasp of the old, incompetent management team. Do not let it scare you away from what I think could be a fabulous comeback story.”
To accompany Jim Cramer’s “buy” recommendation on shares of BBBY, Chris Verrone, Head of Technical & Macro Research at Strategas suggested the company isn’t as bad as the price action would lead one to believe. Fast Money’s Guy Adami also suggested the shares were worth a buy after the Q3 2019 debacle and insertion of a new CEO because the company likely “kitchen-sinked” the quarter.
Finom Group had a completely different view on BBBY shares and has for quite some time. Our chief market strategist Seth Golden had outline the demise of Bed Bath & Beyond dating back to 2015 and warned investors not to buy into any turnaround story back in 2016. Golden’s view on the retailer has not changed since 2016 as the gross margin, sales and EPS have only continued to deteriorate since that time. We encourage our readers to read his analysis from way back then via the provided link.
Finom Group has been short shares of BBBY since the last quarterly report, issuing a trade idea to our Premium Members. We utilized the announced sales update and guidance in after hours on Tuesday to reduce our short position, although we remain of the opinion the share price is still expensive when juxtaposed with the business prospects going forward. Subscribe today and trade with us, using our highly successful trading strategies and live Trading Room daily. Trade safely folks!