
After another record setting day on Wall Street Wednesday, equity futures are in the red. Asian markets finished largely in the red and European equity markets are sharply lower in the early morning hours. Before we get into what’s possibly ailing global equities in a moment, let’s take a few seconds to wax nostalgic about the remarkable characteristics of the bull market that started… well even that is under debate. The market’s breadth has become quite wide in recent days and weeks, finding certain FANG names having faltered and others moving sharply higher.
Amazon (AMZN) shares have soared in recent days and surpassed $2,000 per share on Wednesday. Morgan Stanley reiterated its overweight rating and increased its price target to $2,500 per share from $1,850, representing 29% upside to Tuesday’s close. It is the highest target out of the 41 analysts who cover Amazon, according to FactSet. At a $2,500 stock price, Amazon would have a market valuation of about $1.2 trillion.
Regardless of the premarket activity in the U.S. and whether or not the market finally pulls back a bit or a bunch today, the bull market is a well supported one and supported by strong economy and corporate fundamentals. What we’ve seen in corporate earnings for the Q2 2018 period is S&P 500 earnings growth of roughly 25%, the highest growth rate since 2010. That growth is a fundamental expression of a strong consumer and a strong labor market.
On Wednesday, investors got a second look at Q2 2018 Gross Domestic Product. GDP expanded at a 4.2% annual pace in the second quarter, up from a preliminary estimate of 4.1%, the government said. GDP is the official measuring stick for the U.S. economy. Economists polled by MarketWatch had forecast GDP to be left unchanged at 4.1 percent. Adjusted corporate profits before taxes climb 3.3% in second quarter and they were up a sizzling 7.7% over past year. That’s the biggest 12-month gain in four years.
GDP is growing on the heels of strong consumption from a consumer that has further loosened their purse strings. The government said outlays rose 3.8% instead of the previously reported 4 percent. We had clear indications that consumption would be strong in the Q2 period given the reported monthly retail sales that are growing roughly 6% YOY and big-box retailers that have positively commented on the consumer during the quarterly profit reporting cycle.
At the current rate of GDP growth combined with the projections for FY18 GDP growth, the U.S. economy could be the strongest in several years and as it diverges from the rest of the world.
“The U.S. might top 3% growth in 2018 for the first time since 2005, buoyed by strong hiring, falling unemployment, higher incomes and rising business investment.
Americans increasingly show their optimism in the economy. Consumer confidence rose in August to the highest level in 18 years and reached a peak it’s only matched a few other times in a half century.”
Equity markets follow the trajectory of projected corporate earnings and the realization of those earnings over time. As such and with corporate earnings projected to grow some 20% in 2018, the markets are staying true to form. Debating fair value, over valued or under valued markets is an ongoing and futile exercise, but some choose to align their beliefs with their portfolio nonetheless. According to FactSet, the forward 12-month P/E ratio for the S&P 500 is 16.6. This P/E ratio is above the 5-year average (16.2) and above the 10-year average (14.4). Given these trusted and historic valuations, the market is far from over valued. Moreover, given the fact that earnings have come in some 4-5% higher for S&P 500 earnings in each of the first 2 quarters of 2018, the market may prove to be undervalued later this year when the Q3 reporting cycle comes around in November. Of course, a lot will happen between now and then.
Moreover, what will likely continue to “plague” equities between now and November are those doomsdayer rants and permabear raves. Let’s face it, they never go away or end their assault on the market. As pointed out by reporter Shawn Langois from MarketWatch, Jon Boorman, technical analyst and portfolio manager for Broadsword Capital, has been tracking this bears vs. the S&P 500 battle for a while now, and, needless to say, it’s been a lopsided affair. Take a look at Boorman’s graphic below:
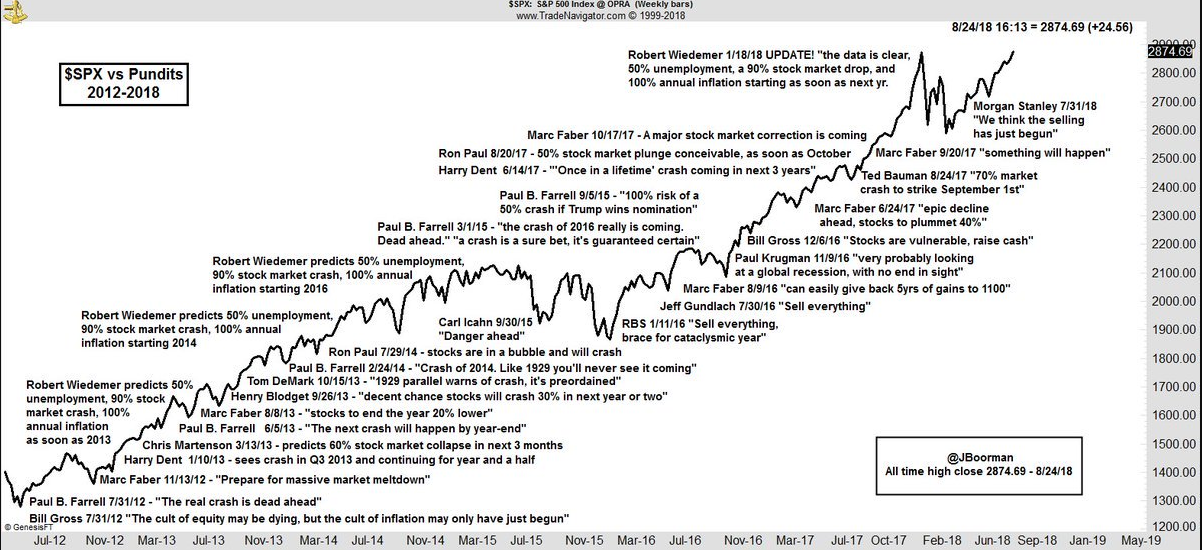
Boorman calls out the likes of former congressman Ron Paul, who last year forecast a 50% correction, and MarketWatch’s own Paul Farrell, who predicted a “100% risk of a 50% crash if Trump wins the nomination.” Then there’s the epic “sell everything” calls from RBS in January 2016 and again from Jeff Gundlach a few months later. Oh Gundlach! The most recent fail came from Morgan Stanley, which forecast “the selling has just begun” in July.
Wrong, wrong and more wrong all the way up the S&P 500 ladder have been the permabears. But let’s be honest; there has been a huge wall of worry presented before the S&P 500 since the Financial Crisis. The wall of worry itself has actually aided in characterizing this bull market cycle as one of the most hated in history. Given it’s roots came to be planted by way of government bailouts, extreme liquidity and printing money to seemingly no end, it’s no wonder the bears have been ranting and raving for so long.
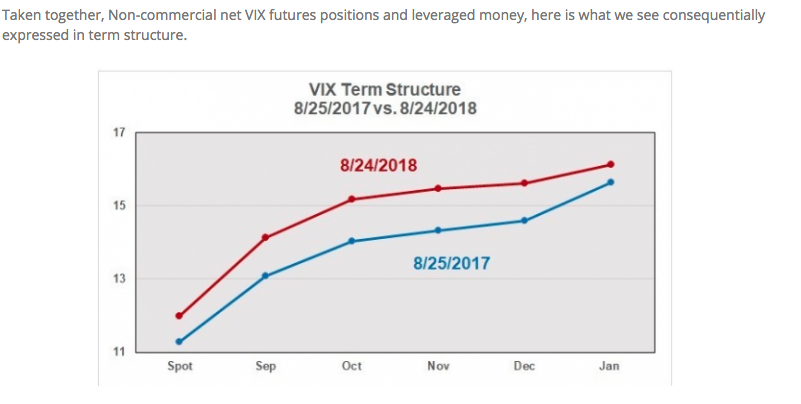
We’ve been discussing in our most recent reporting at Finom Group the decoupling of the S&P 500 (SPX) from the VIX in recent days. Typically, the VIX trades inversely to the SPX, but in recent sessions they have a shared directional move. In our daily article titled When the S&P 500 and VIX Share Trading Trajectory?, we outline why this is happening. We fully recommend investors read this article to better understand the anomaly and why this “divergence” is taking place. The following screenshot offers a broad context for the divergence and lends itself to what our chief market strategist has recently been discussing with subscribers and in social media.
In a tweet yesterday, Seth Golden offered the following on the subject matter though:
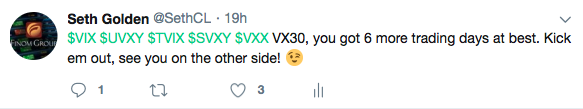
It’s a bit cryptic obviously and purposefully. But basically it denotes the possibility of time proving favorable or unfavorable for VX30, depending on how a trader has positioned their portfolio trades, long-VOL or short-VOL. VIX futures will be nearly halfway through their “life cycle” come this time next week. The calendar for VX30/m1/front month future contract becomes increasingly exposed to decay the further out in the contract’s life cycle. Yep, just like any other living, breathing entity, futures are not decay proof! So let’s pull up VIX Futures Term Structure to see what we have on the calendar and/or in the way of potential decay.
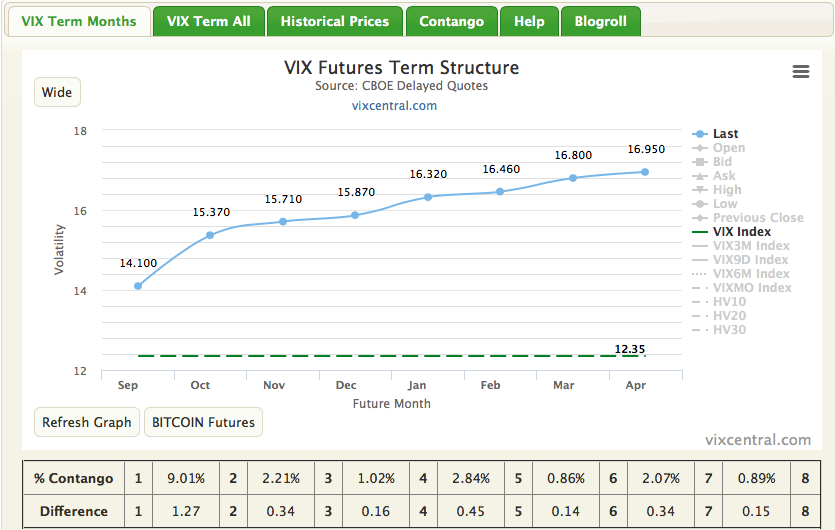
At present, VIX futures are in steep contango as they approach the halfway point in their life cycle/expiration cycle. A future’s cycle is roughly 30 days. Everyday, a VIX-exchange traded fund has to sell one of the front month futures or 1/30th the notional value of the front month futures and buy back month futures to replace them in order for the VIX-ETF to maintain its general formula for operation. With that being said and contango on the rise since the last expiration, decay is building or being hoarded by the VIX-ETF so to speak, even though it hasn’t been represented in the price per share of the VIX-ETF. In other words, VXX, TVIX, UVXY haven’t really decayed in-line with the building of contango nor the movement in the VIX over the last couple of days. VIX futures have essentially remained stubbornly high regardless of the movement in the VIX itself. The following is a recommended YouTube video by David Lincoln that explains and paints the picture as to what VIX futures are doing, inline with our context here.
Portfolio and fund managers have been building a safe guard/hedge for their capital investments over the last couple of weeks and with the S&P breaking out to new record high levels. This is largely done through S&P 500 (.SPX) put options, which translates to a VIX reading of complacency and/or fear. Given the outsized hedging taking place, it serves to boosts the fear gauge, even as the S&P 500 is rising. If the S&P 500 and broader stock market does pull back from its highs, capital investments have some downside protection. But in terms of using VIX futures and options as a hedge against downside in the market, timing and/or duration are critical to the efficacy of such protections. The investor’s timing is either going to be proven right or the exercise in hedging is going to be nothing more than a tax on the portfolio. More often than not, the latter is the proven outcome.
Given the aforementioned life cycle and calendar for VIX futures, which will approach their halfway point next week and combined with so much hedging having already taken place, Seth Golden was indicating to traders and investors in his tweet, that there is little time left for VIX futures to maintain their elevated levels compared to spot VIX. Compared to spot VIX is the key verbiage. VIX futures can remain elevated and even move higher depending on spot VIX movement. The VIX moves quicker than VIX futures prices, so if the VIX spikes significantly by this time next week, contango will be curtailed and hedges will be proven more effective. However, if all things remain at current levels or lack significant change, VIX futures will fail and find themselves likely falling/decaying more sharply (due to selling pressure) given the VIX futures calendar and life cycle.
It’s possible that more hedging takes place by fund managers in the coming trading sessions also. You simply don’t know until you know. As such, let’s take a look at the S&P 500 RSI for a reading on whether or not the market is overbought.

As you can see from the chart, the S&P 500 has become overbought for the first time in a quite a while. The 14-day RSI has reached 70 for the first time since late-January 2018 while it remains above its 200 daily moving average. In other words, momentum has returned to the stock market, which tends to indicate a near term topping cycle.
With the RSI extended and the market having run so much in the last 30 days, this doesn’t spell the overall top for the market, but rather a need for the market to take a breather. Value is hard to find in a higher trending market and one that is at all-time highs and as such it is likely that buying pressure will subside soon enough. How long or large of a pullback is the market in store for remains to be seen. One thing is for certain though, a February-like market pullback/correction is not as likely as permabears might propose. The variables in February are not the same as today. Additionally, markets tend to not repeat previous moves of consequence so close in time as investors take action to avoid a like consequence. Proof of this comes to us by way of a recent study from Troy Bombardia of bullmarkets.com.

This is what happens next to the S&P when its RSI exceeds 70 for the first time in 7 months, while being above its 200-day moving average (i.e. in an uptrend). If history is any indication…
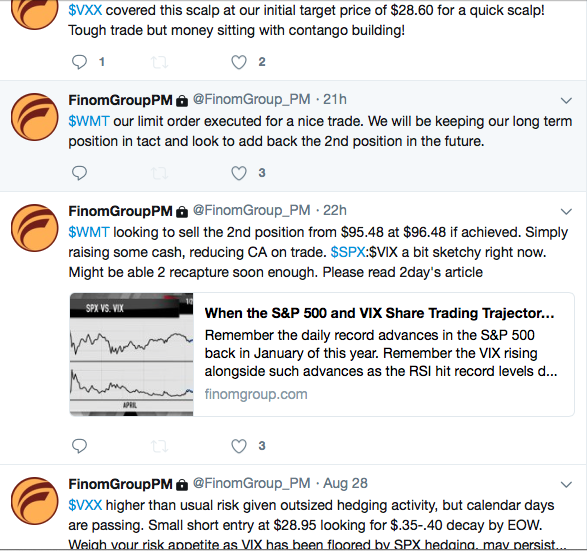
Whether or not the stars are aligned for a decent market pullback and VIX spike is not yet known. “Market star alignment” is an ever-changing target! Having said that, I think we’ll know by this time next week, so check back in with us then. Regardless of what the market does, we’ll be trading it as always. On Wednesday we had two trades closed out for a nice profit as indicated in the screenshot below:
Subscribe today and receive our daily trades and longer-term trade alerts!


