
Welcome to another trading week. In appreciation for all of our Basic Membership level participants and daily readers of finomgroup.com content, we offer the following excerpts from within our weekly Research Report. Our weekly Research Report is extremely detailed and has proven to help guide investors and traders during all types of market conditions with thoughtful insights and analysis, graphs, studies, and historical data. We encourage our readers to upgrade to our Contributor Membership level ($14.99/monthly, cancel anytime) to receive our weekly Research Report and State of the Market videos. Have a great trading week and take a look at some of the materials from within this week’s Research Report…
Research Report Excerpt #1
I spoke about this August delivering the worst of August returns to-date. The chart below from Optuma depicts this characterization pretty clearly.
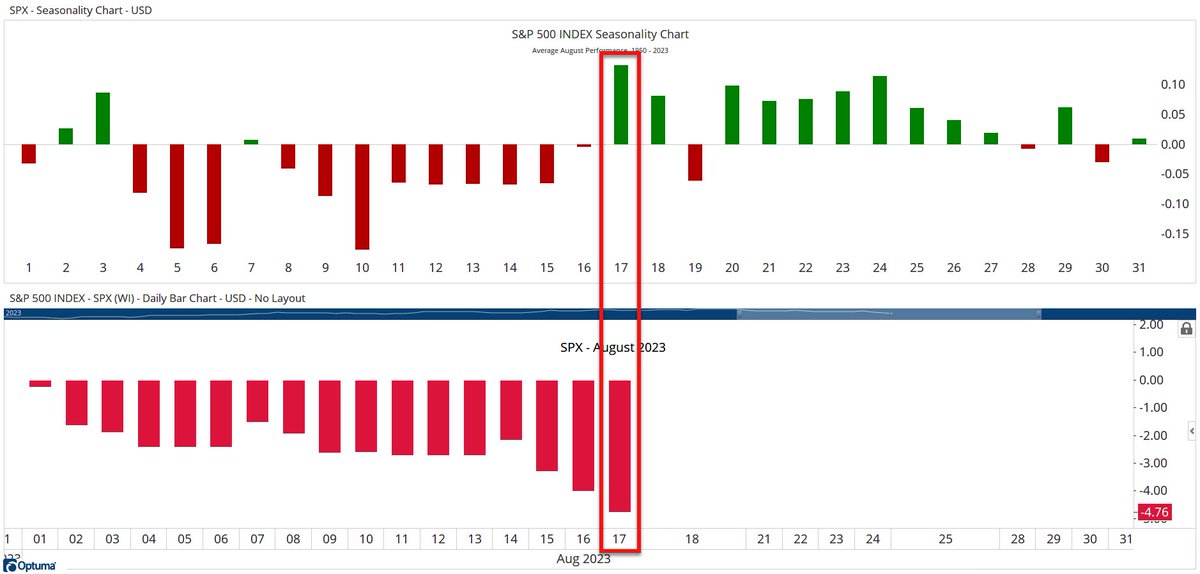
Historically, August 17th has been when the S&P 500 (SPX) turns positive for the month, but not this year. At -4.76%, this is the worst start to August since 2011.
Research Report Excerpt #2
Even with the S&P 500 down a point this past Friday, the VIX and VVIX were down sharply. It has been studied and proven that the VIX and VVIX have a very close relationship, with VVIX typically foreshadowing the next VIX move. In other words, VVIX tends to be a leading indicator for the VIX. Think of it like a car. The VIX is like the speed of a car cruising down the road. You just know the speed. You can’t tell if the car is speeding up or slowing down. For that information, you need to know the car’s acceleration. VVIX is the acceleration. With this in mind we compare the weekly price action for both VIX and VIX.
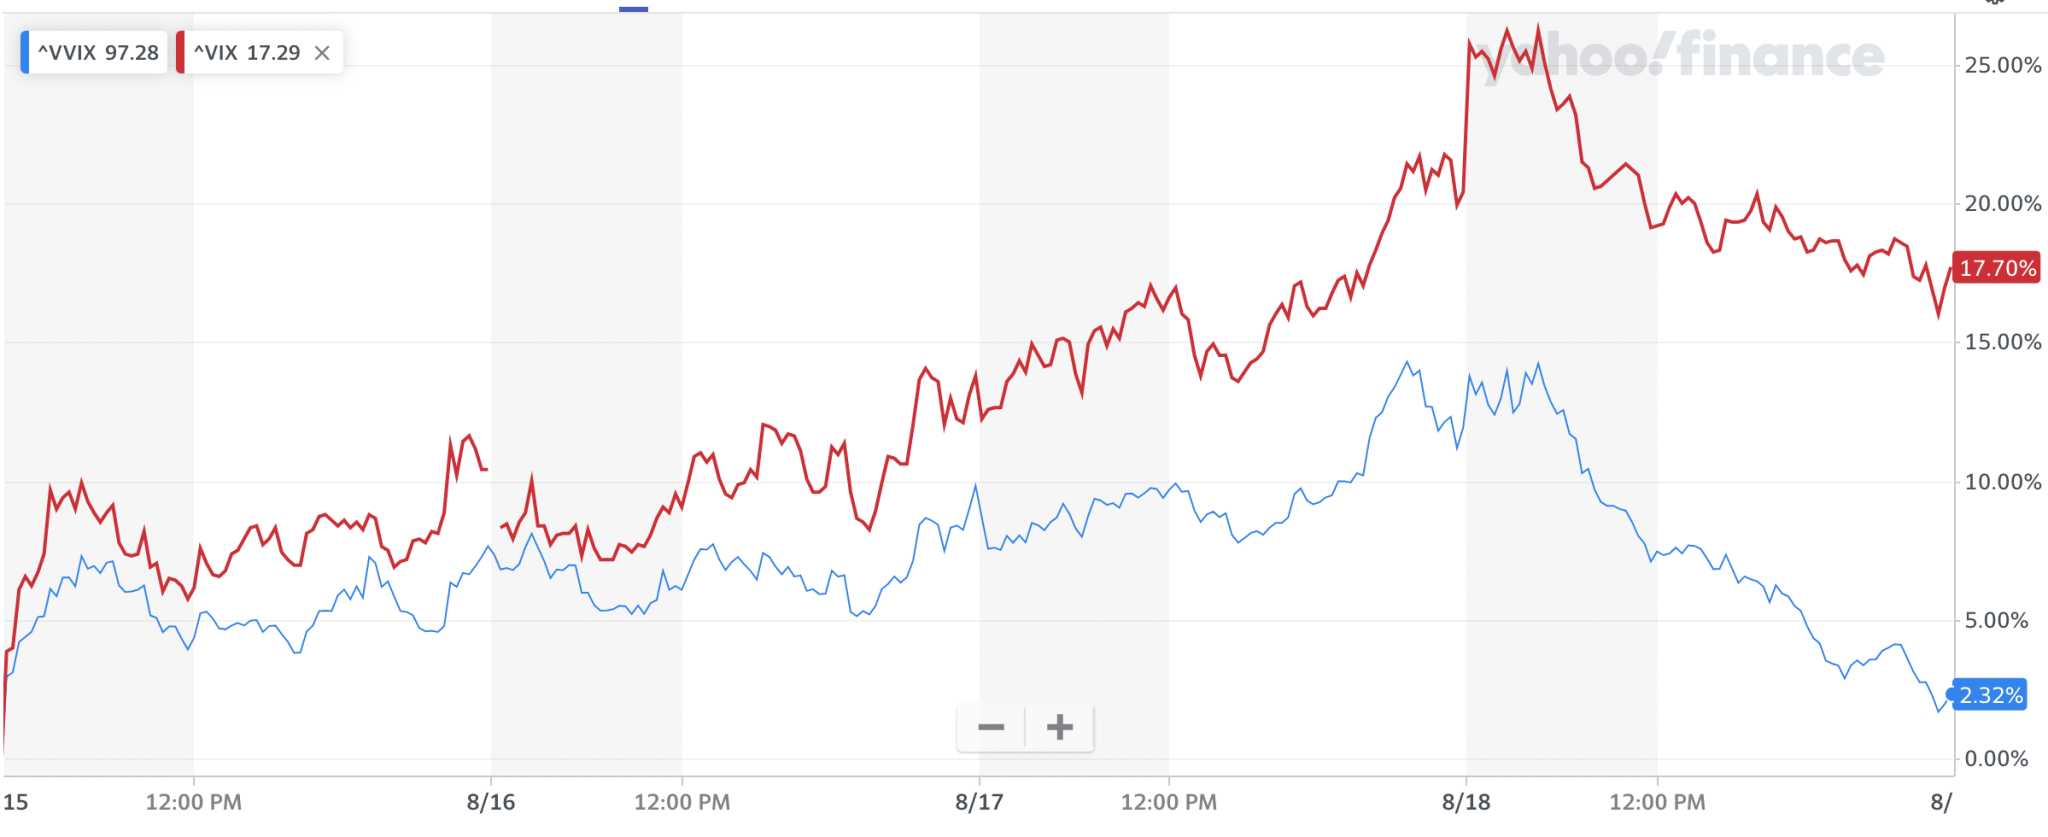
For the week, VIX was up 17.7% while VVIX was up 2.32 percent. Additionally, it looks as if VVIX accelerated to the downside on Friday, falling 8.8% while the VIX fell only 3 percent.
Research Report Excerpt #3
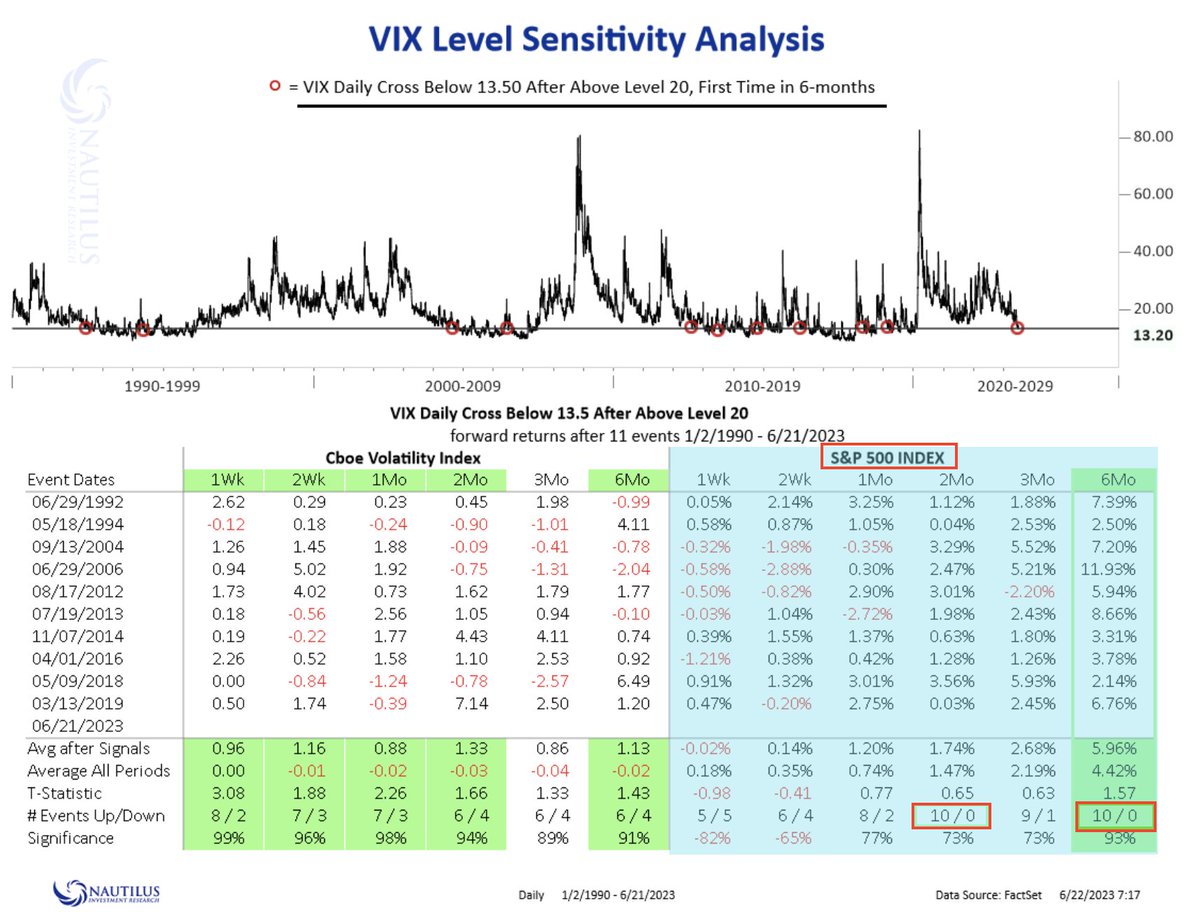
- VIX fell below 13.50 for 1st time in at least 6 months on June 21.
- The S&P 500 closing value was 4,365 when it happened. That’s roughly 100 points lower than the Friday closing value of the S&P 500.
- Since 1992, 2 and 6 months later the S&P 500 has never been lower than signal date. The 2 month mark will be tested on August 21, 2023. If the S&P 500 is higher than 4,365 by then, the study will maintain its 100% positivity rate.
- (Nautilus Research)
Research Report Excerpt #4
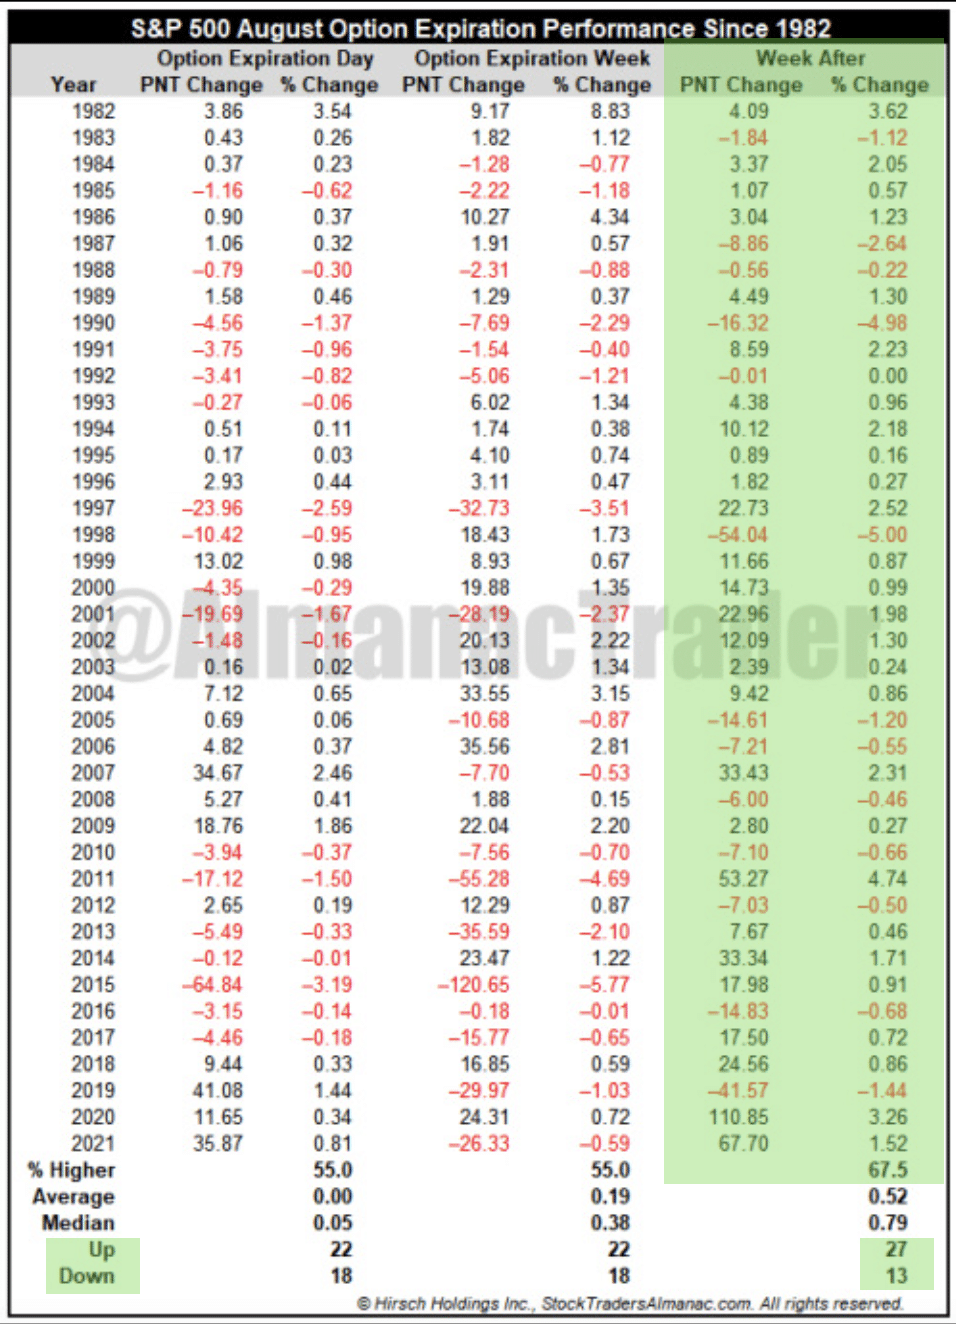
As shown in the table above from The Almanac Trader, the S&P 500 has been only slightly higher and only a slight majority of the time during monthly Op/EX week. Based on this observation, even that slight positivity rate didn’t work well for this past August Op/EX period. Having said that, the week after monthly Op/EX (this coming week) has delivered above average weekly returns and higher 67% of the time; 27 times up and 13 times down, with a +.52% average weekly return.
Research Report Excerpt #5
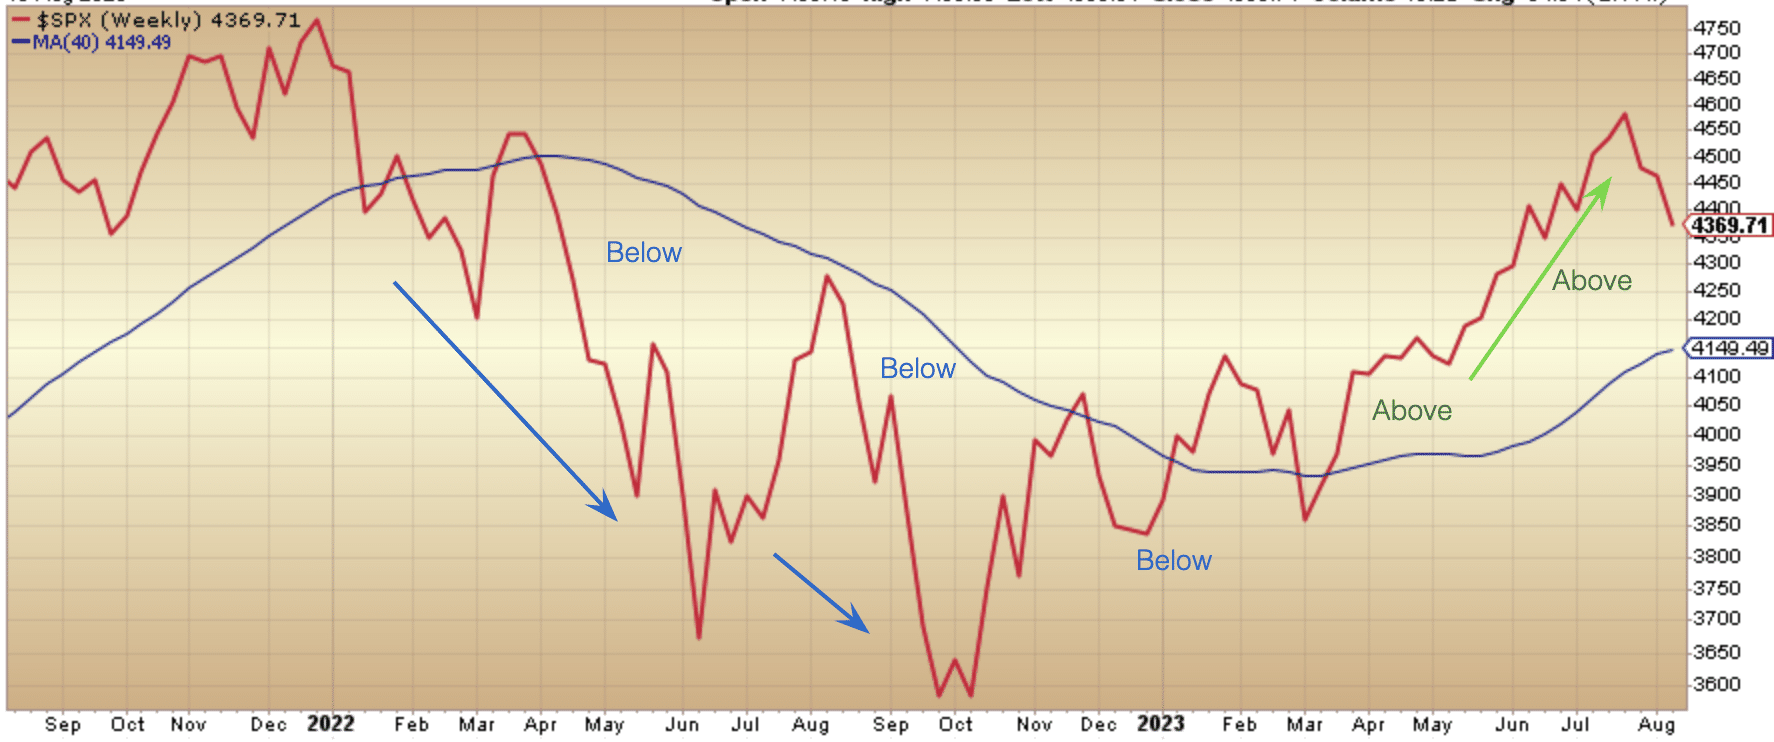
The fact that the market has remained above its 40-WMA for consecutive quarters not only validates the bull market, but also heralds corrections as “buyable.” We would only become more concerned if the 40-WMA is breached, which we do not suggest holds a high probability, given all our outlined August – December forward return studies.
Research Report Excerpt #6
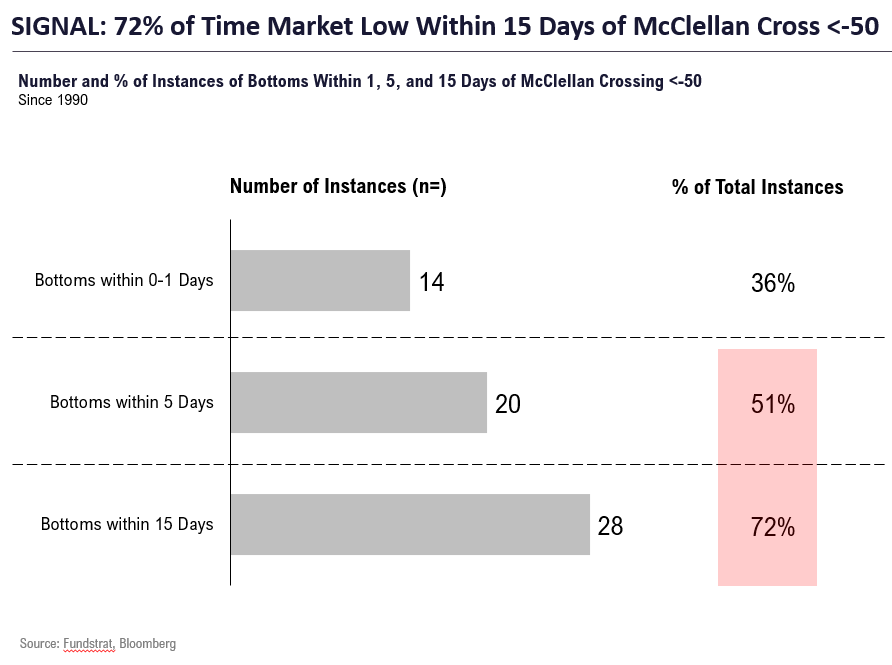
As shown in the Fundstrat table above (going back to 1990), when the McClellan Oscillator crosses below -50 the majority of market bottoms occur within 15 days, while very few occur within a day of the oversold condition. I think the more determining factor, that may suggest the consolidation period bottom has already or will occur more quickly than the 15-day period is the fact that the McClellan Oscillator achieved -100, a much more oversold reading than -50, obviously.
Research Report Excerpt #7
Retail sales reported this past week proved a major boon for the quarterly GDP potential when it finalizes. Month-over-month nominal retail sales in July were up 0.7% and up 3.17% year-over-year. The expectation was for up .3% month-over-month. The prior monthly retail sales report was also positively revised by .1 percent.

The back-to-school period might have something to say about where the economy is headed over the second half. According to the National Retail Federation, this year’s back-to-school season is expected to feature record spending across all channels.
Research Report Excerpt #8
Trust me, I know there are growing concerns about China’s recovery and how that might create headwinds for the U.S. economy and/or stock market, but let’s step back and look at the big picture. Consider this:
- China’s economy was in lockdown for the greater portion of 2022. The U.S. economy performed just fine, growing at roughly 2.5% GDP annualized.
- The China economy opened in early 2023 and is tracking 5% GDP to-date. The U.S. economy may achieve 3% annualized GDP in 2023.
- While China’s GDP and economic recovery have not lived up to economists estimates, it has not proven to detract from U.S. economic growth, and still proves a tailwind, even if that tailwind is not as strong as previously estimated.
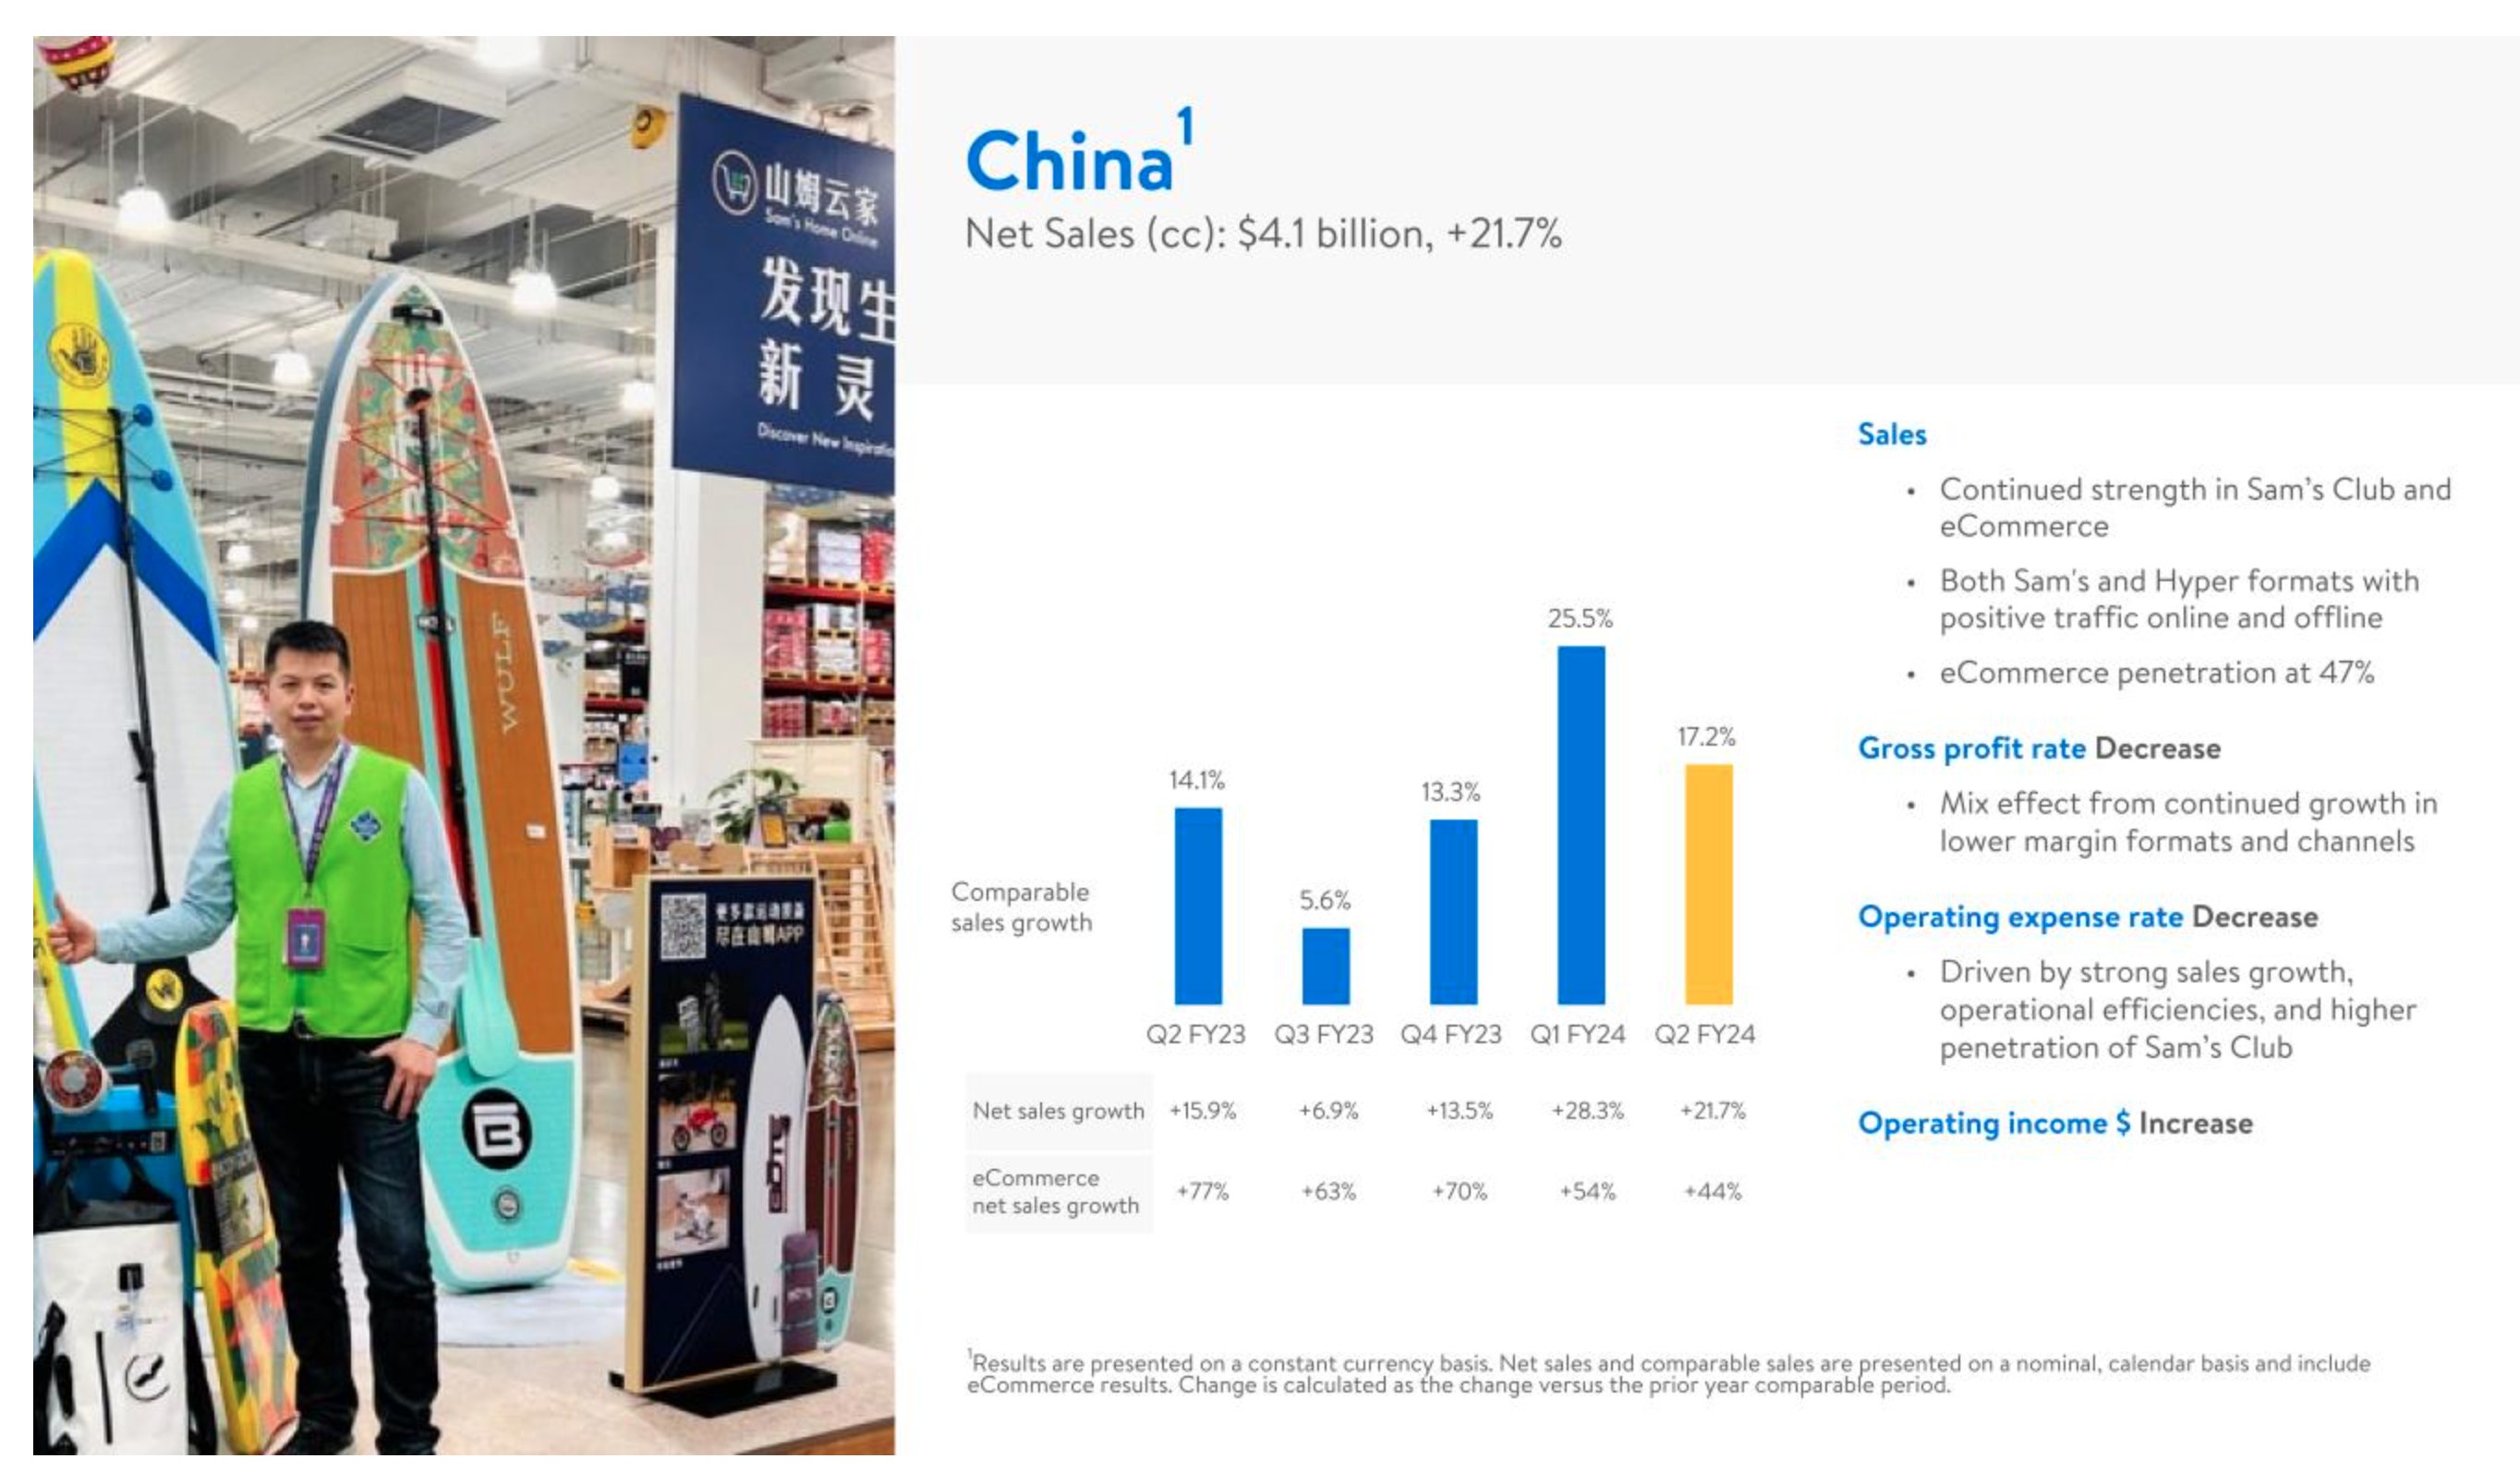
Less than 5% of S&P 500 revenues come from China, and while a weaker growth reality may be the case for China, the latest quarterly results from Walmart do not suggest it has deterred its sales in the region year-over-year (data above from Walmart’s Q2 results transcript).
Research Report Excerpt #9

Lastly, but certainly not least, is the outlook from Oppenheimer’s Ari Wald. As described in the S&P 500 Bull Market Cycle chart/table above, Wald is of the opinion that the current bull market is both a young bull market and an undervalued bull market. When compared to prior bull market cycles, the current 9-month old bull market which began in October of 2022 would likely have a life cycle that averages 34 months (middle column).


