
Welcome to another trading week!! In appreciation of all of our Basic Membership level participants and daily readers of finomgroup.com content, we offer the following excerpts from our Weekly Research Report. Our weekly Report is extremely detailed and has proven to help guide investors and traders during all types of market conditions with thoughtful insights and analysis, graphs, studies, and historical data/analogues. We encourage our readers to upgrade to our Contributor Membership level ($7.99 monthly, cancel any time) to receive our Weekly Research Report and State of the Market Videos and take advantage of this ongoing promotional event today! Have a great trading week, be in touch, and take a look at some of the materials in this weekend’s published Research Report!
Research Report Excerpts #1
The market offered many teachings in 2020 and there will have to be much to learn going forward, as unprecedented circumstances lead to more unprecedented reactions to those circumstances. If we accept this as fact, we should also acknowledge how wrong it would be to defy history, which often rhymes. Unprecedented circumstantial reactions will still likely fall along the lines of typical human behaviors.
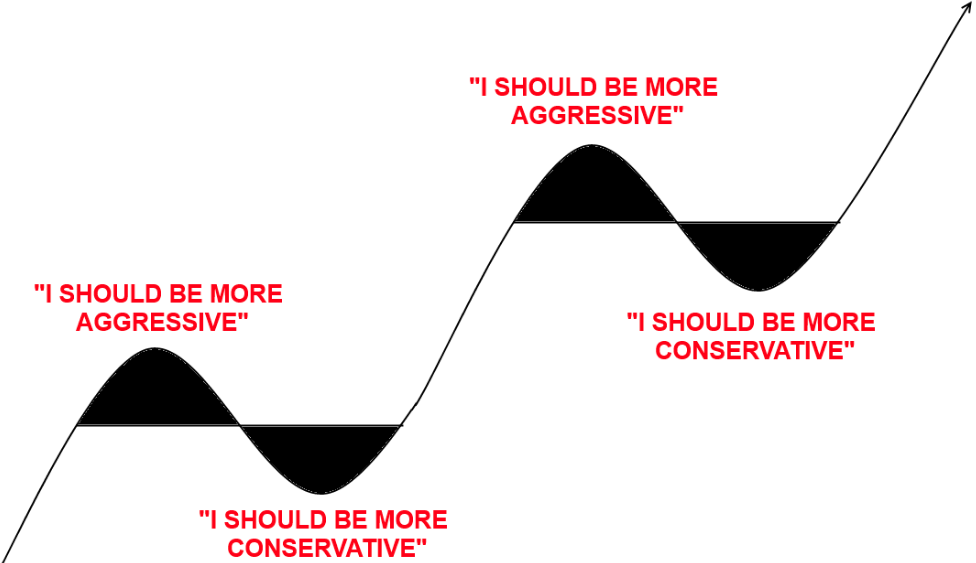
The above positioned graphic from Cullen Roche is the psychological framework for engaging the market we want investors to avoid. The dip buyers are the rewarded ones while the fearful sellers are the ones that are left behind.
Research Report Excerpts #2
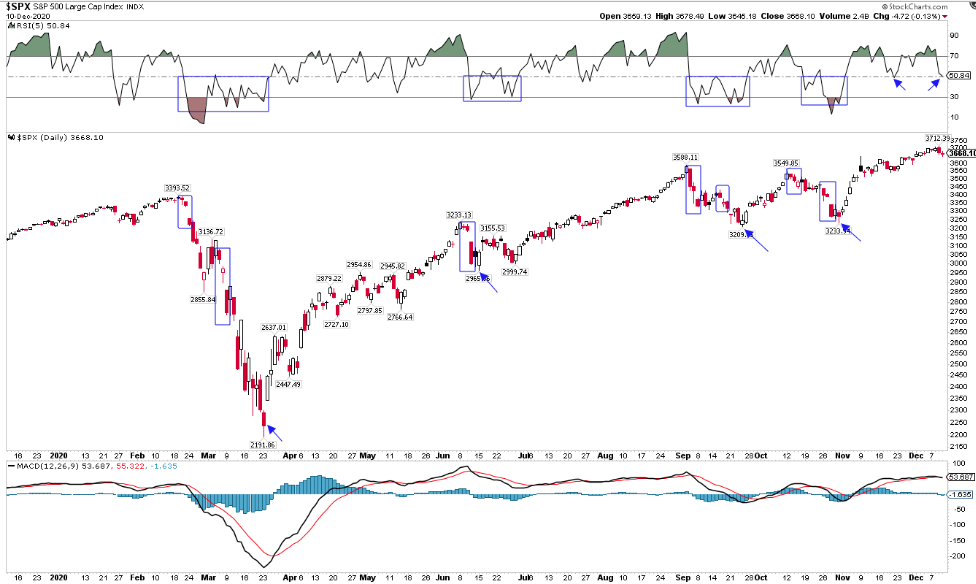
One could easily make the argument that it was the most feeble 3 down days we’ve witnessed and they’d likely be correct! Nonetheless in 2020, three down days in a row have typically led the market lower, as offered in the chart above and signified in the rectangles. The market’s momentum indicator is in the top panel. Having said that, 2020 is but a small sample size. I would be remiss if I din’t also offer that over the last 5-year period, after a 3-day losing streak, the market was higher the next days some 90% of the time. **
At this point in the market’s rally, it’s perfectly normal to see some degree of profit taking and turbulence. Let’s face it; the market has been overbought for an extended period of time now, but that doesn’t necessarily tell us when or by how much the market should/will consolidate some of its gains. Nonetheless, and as noted already, the market will not go higher in a straight line.
Research Report Excerpts #3
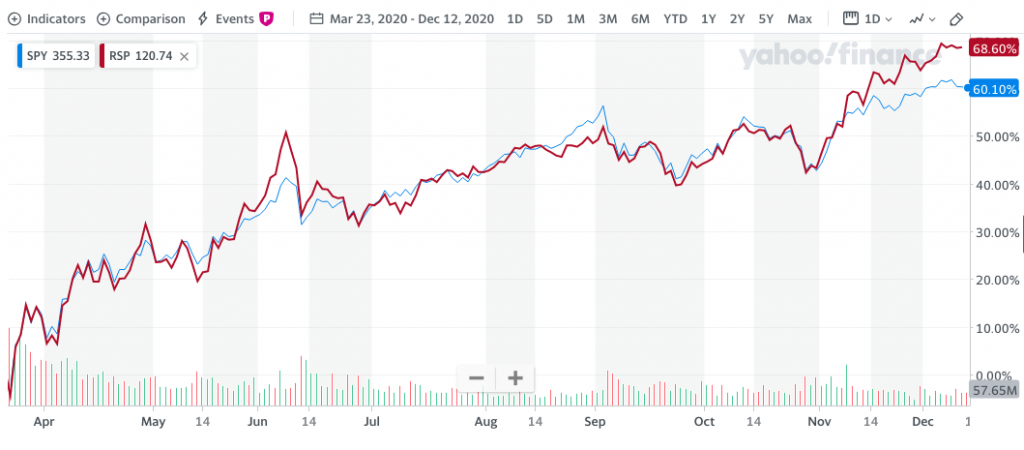
More broadly and technically speaking, the equal-weight S&P 500 (RSP) continues to outperform the cap-weight S&P 500 (SPY) since the March lows, indicating broad market participation and a healthy bull market. These are all the trappings of a new cyclical bull market, post a cyclical bear market, and in-keeping with a longer-term secular bull market.
The comical thing about the “everything rally” of late is: The same traders, strategists and analysts that were complaining about just a handful of stocks driving the rebound in May are now complaining that everything is rising since November. These complainers are the very definition of permabears; nothing is good enough for them and they often contradict themselves.
Research Report Excerpts #4
The pandemic ended the longest economic expansion ever, lasting more than 10 years, from 2009-early 2020. The ensuing recession was unique in that we didn’t see the usual extremes like excessive spending or over-leverage/debt that have been the hallmarks of the end of past economic cycles. In fact, the household debt obligations to disposable income ratio was on a decisive downtrend throughout the whole of the previous expansion cycle.
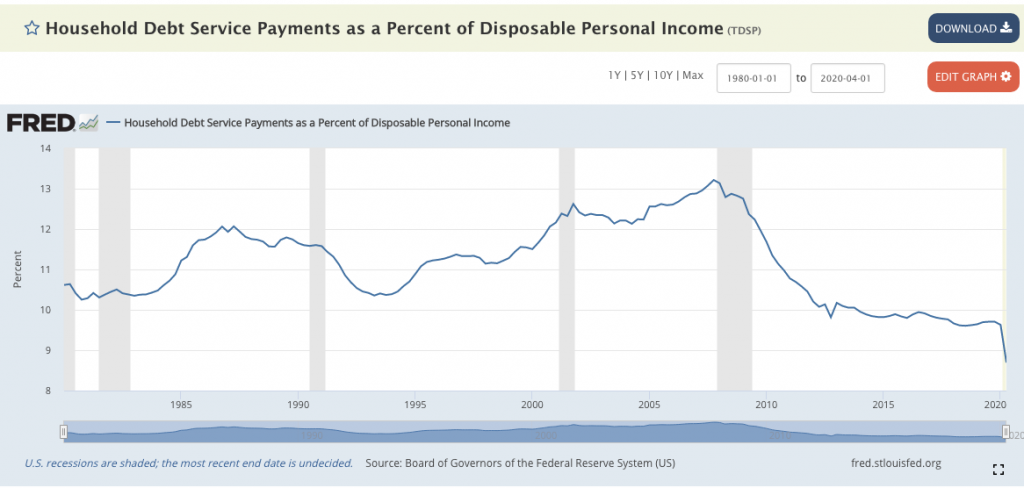
This ratio that identifies the household balance sheet is at its best level in history. Today’s households have learned valuable lessons from both the Dotcom and Great Financial Crisis era peaks, as it pertains to leverage/debt. When we look at the household balance sheet we recognize a STRONG FOUNDATION! From strong foundations, I’m of the belief an even stronger period of economic growth will be found in the coming years, only to be bolstered by pending, additional stimulus which some believe is necessary to stave off a double-dip recession. A double-dip recession is not my base case, but to the degree that thousands of Americans feel forced to go to work despite an ongoing pandemic, at the very least more fiscal relief can prove a two-pronged attack: Saving lives and bolstering the economy.
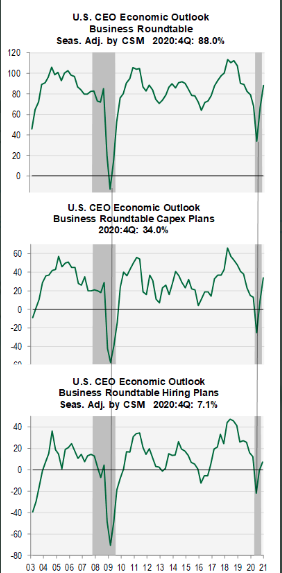
Research Report Excerpts #5
The Business Roundtable’s 4Q confidence survey jumped 21 points. It shows companies plan to boost Capex and hiring. This reinforces my belief that profits & EPS will hit record highs together in 2021.
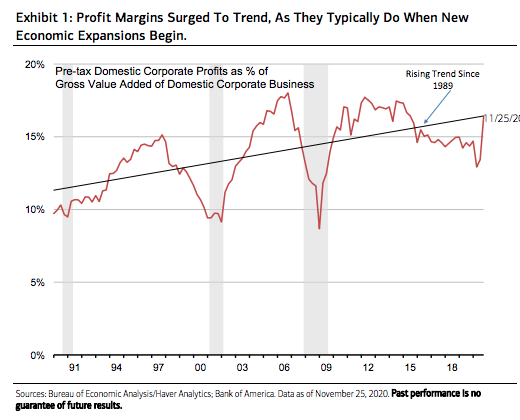
Research Report Excerpts #6
So far, the combination of a decades-high pace of revenue growth with a big margin expansion (Exhibit 1) has boosted Q3 pre-tax profits as measured in GDP accounts by an eye-popping 27% quarter-to-quarter, to a new record. The strong profits rebound from the shutdown clearly shows that the effect of the global government support has been widely and massively underestimated. So has the combination of pent-up demand and the role of operating leverage in supercharging margins and profits at the beginning of new business cycles.
Research Report Excerpts #7
While I still anticipate a subdued Holiday shopping season and stress on brick and mortar retailers into 2021, the latest Bank of America Card spending data has improved from the prior week’s dissemination. (1-week lag)
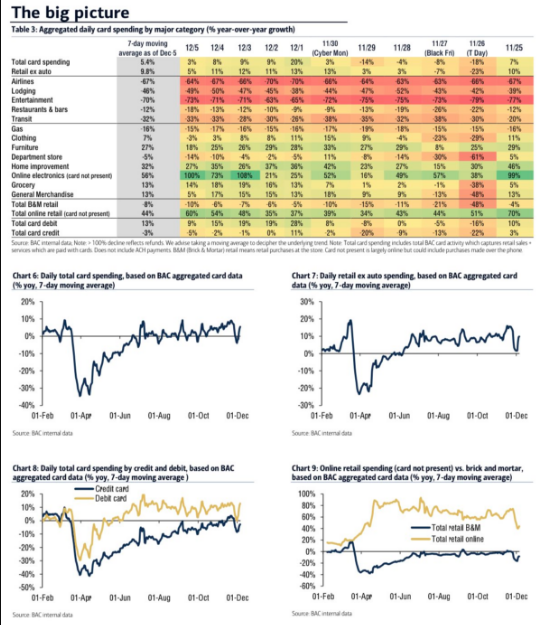
Unfortunately, the positives gleaned from the latest BAC data are not mirrored in the Chase Card spending data. This is what makes some of the high-frequency data less useful than otherwise desired.
Research Report Excerpts #8
Canaccord Genuity’s chief equity market strategist Tony Dwyer appeared on CNBC and recently discussed how the low interest rate environment provides yet another tailwind for corporations into 2021.
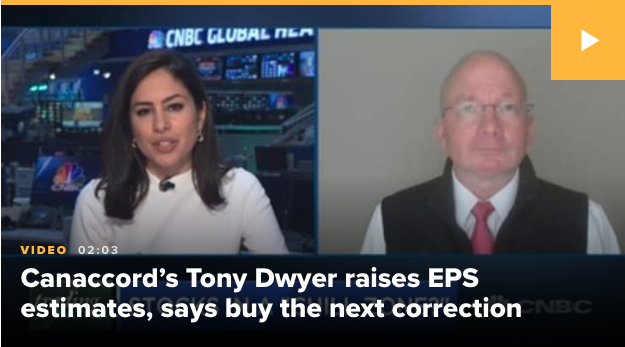
“There are three levels of stimulus that have come into the marketplace. We’re in a pandemic marketplace. Of course, you’ve got the monetary stimulus. We’ve got an infinity Fed. We’ve got the fiscal stimulus, [the] $2.2 trillion Cares Act which will likely have more to come in the coming week if Congress can get their act together.”
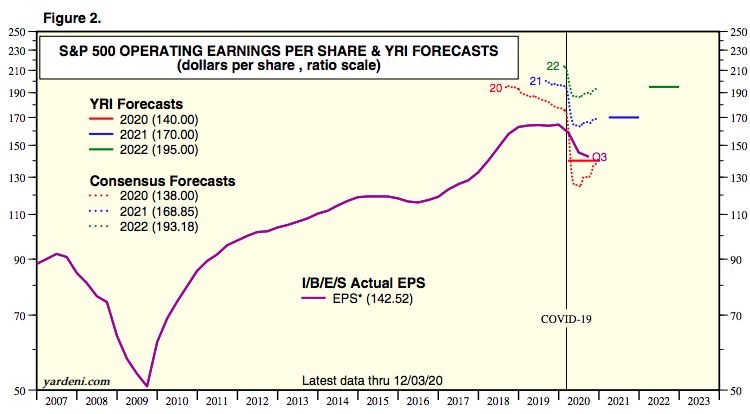
For this year, Dwyer’s EPS expectation is $138 a share from $125. In 2021, Dwyer now calls for $176 a share versus $165. Yardeni Research consensus is at $168, which has risen for months now.
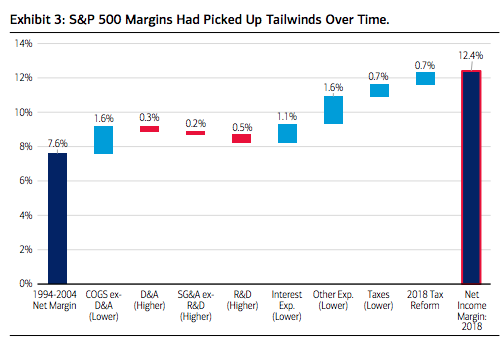
Let’s put just a little more meat on “this bone” for Tony Dwyer with some details about his low rate reference and how it provides a tailwind for earnings. Lower interest rates, all else equal, auger for lower interest costs, which also should bolster net margins especially considering the swell in non-financial corporate leverage, which now totals nearly $11 trillion. This year alone Securities Industry and Financial Markets Association (SIFMA) tracks almost $2.1 trillion of U.S. corporate bonds having been issued with many companies citing the desire to refinance or lock in lower rates for longer as their driving force. Some S&P 500 constituents issued 40-year paper with coupons at or below 2.5%. In addition, tax policy also takes on particular relevancy. Corporate taxes have trended lower over the past couple of decades, with the Tax Cuts and Jobs Act of 2017 being the most recent stimulant, which helps to increase after-tax profit relative to prior periods. According to BofA Global Research, lower interest expenses have added approximately 1.1% to net income margins since 2004, to which tax reduction has contributed an additional 1.4% through 2018 (chart below).
Research Report Excerpts #9
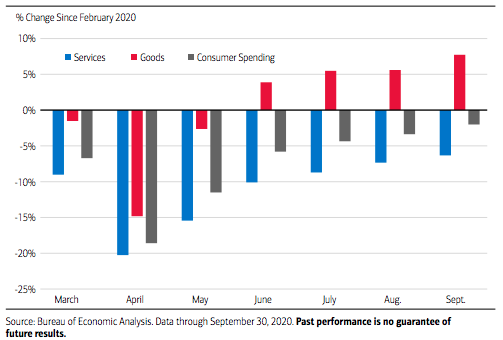
There will be a great many economists focusing on the service sector once economies fully reopen, as it has proven to be the hardest hit sector during the pandemic period. Dollars held in savings deposit accounts totaled $11.9 trillion for the week ending November 27, an amount that suggests many Americans aren’t sitting on a savings cushion, but a savings couch. So with household savings as an indicator for future consumer spending, think of the $1.3 trillion in excess savings as cash reserves for rising consumer expenditures into next year, especially in services once this part of the economy is unleashed with continued progress on the health front. While we’ve seen consistent month-to-month improvement in personal consumption broadly recovering in line with GDP, the latest data show the drop in spending is attributable to services remaining depressed at 6.3% lower compared to pre-crisis levels. As highlighted in the chart below, in the months since February, goods have helped balance the spending equation, up 7.7 percent.
Thank you for joining us for another trading week and reviewing our weekly “Must Knows”! To receive and review our weekly, full-scale Research Report each Sunday and our State of the Markets weekly video analysis every Thursday, subscribe to our Contributor Membership level at just $7.99 monthly (Cancel any time)! With these two weekly deliveries, you’ll have all the unbiased and fact-driven market and economic data analysis at your fingertips. Don’t make capital allocation decisions based on headlines that brush the surface of what is and isn’t affecting markets. Let our deep-dive analytics supply you with bottom-up and top-down analytics. You won’t be disappointed. Upgrade today!!


