Good morning and welcome to another trading week that is expected to be rather subdued, but as we know, on any given trading day… anything can happen. With that being said, here are a few notes to consider from our weekly Research Report. In order to read our very detailed weekly Research Report (12 pages), subscribe to our Contributor or Premium Memberships. With Finom Group’s Premium Membership, you will also have access to all of our trade alerts and Trading Room that begins each trading day at 9:00 a.m. and ends at 4:00 p.m. EST.
Our trading strategies and expertise are experienced daily in our Trading Room and via our private Twitter feed. But without further delay, here are some of the focus topics outlined in this week’s Research Report:
S&P 500 2,900
Last week’s weekly expected move for the S&P 500 was $37/points and this was achieved by Tuesday of the trading week. By the completion of the trading week, the S&P 500 finished outside of the weekly expected move, with volatility further declining. The VIX closed at 12.82 for the week, down more than 6 percent.
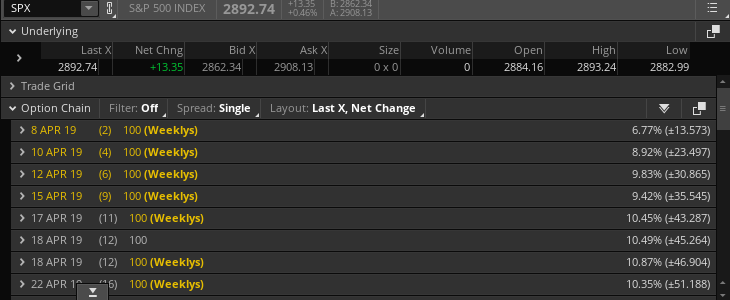
As displayed in the screenshot above and in keeping with a decline in implied volatility WoW, the S&P 500 weekly expected move for this coming week is roughly $31/points.
If we have said it before we’ll say it once again, the current rebound in the S&P 500, as well as its peer indices is nothing short of remarkable. Several variables allow us to characterize it in such a way, but probably the one that stands out the most is the lack of pullbacks. So far, there has only been one week in 2019 where the S&P 500 retraced by just over 2 percent. As of Friday’s close, the S&P 500 has gone 69 days without a 3% sell-off.
Fund Flows
What we know is that there are 3-4 main components executing the market’s confounding rally.
- Corporate buybacks
- Light re-leveraging
- Dealer gamma imbalance forcing buying underlying stock.
- Short covering
S&P 500 firms have repurchased $227 billion of their own stock in the first quarter of 2019, according to FactSet data, up from $143 billion in the first quarter of 2018. Coupled with corporate buybacks is the notable light re-leveraging amongst fund managers and pension funds. And then there is the nasty element that reversed course from late 2018 and as the calendar year turned. U.S. index delta-adjusted open interest is now $446bn vs. -$1.2tn at the Dec’18 lows, and $916bn at Jan’18 highs). This is the gamma imbalance, where the higher the market rises, the more dealers are forced to buy. It’s not short covering to be clear, but rather quant weighted market balancing. Additionally, it doesn’t require a new seller to produce a buyer. This is an important point in the gamma imbalance that goes overlooked. Recall that during the Q4 2018 period, for such severe market moves lower and daily, the selling pressure was very light, just as it is today as the market rallies and volume has only become lighter as the rally has carried onward to-date. Yousef Abbasi, director of U.S. institutional equities and global market strategist at INTL FCStone said volumes are running 15% below the average, even on big data days.
Regardless of volumes, J.P. Morgan is of the opinion that if financial conditions remain favorable, economic conditions continue to improve and the geopolitical trade feuds are settled favorably, the gamma imbalance will accelerate, forcing more dealer buyers of the underlying (stock) and possibly leading the S&P 500 to achieve 3,000 by month’s end or early May. This outlook also assumes an earning season that “isn’t a total disaster”, as J.P Morgan’s Marko Kolanovich recently offered to CNBC.
Economy Slowing to Trend-Growth
Since the Q4 2018 period expressed a slowing from the “sugar highs” of the Q2-Q3 periods, Finom Group has been of the opinion that slowing growth was inevitable and recessionary conditions weren’t present or even probable near-term. In short, the most likely economic growth outcome was a resumption of trend-growth. Trend-growth is an economy that expresses GDP from 1.75%-2.5%, depending on whom one asks.
For the Q1 2019 period, the range of forecasts for GDP are quite wide but found narrowing and above 1.4% by and large. Fears of a recession tend to coincide or commence around the Q1 period, always. This is largely a seasonal factor and one that we can validate. Between 1986 and 2015, real GDP growth for Q1 averaged 1.78% compared to 2.86% across Q2, Q3 and Q4.
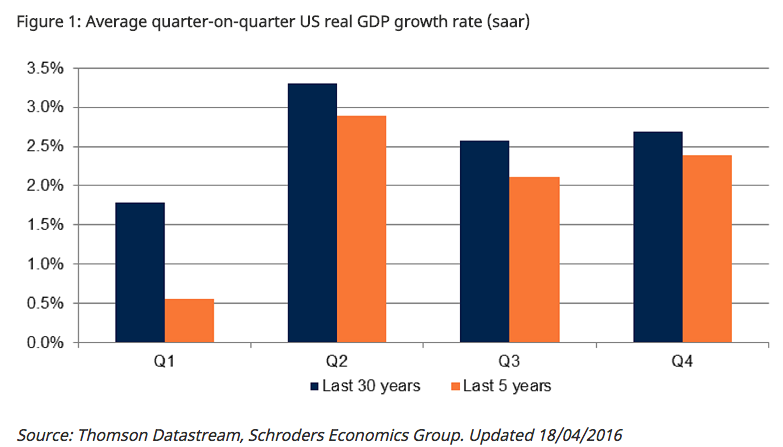
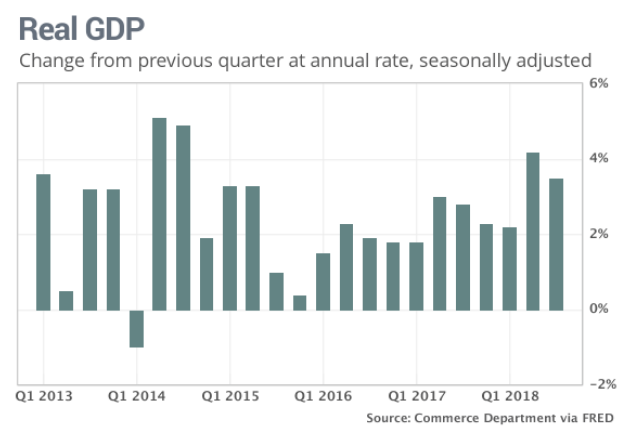
While the above study ends in 2015, we can see the same pattern since that time in the following chart:
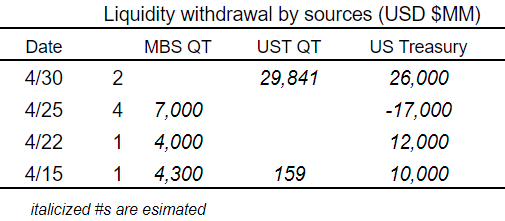
The JOLTS survey and FOMC are likely the key focus for the week. As the Fed remains sidelined for 2019, the minutes will be carefully combed over by economists and market participants alike. Quantitative Tightening is still in the cards until September and as such, April’s QT schedule is depicted below: (Barton Options)
Earnings Season Underway
Finom Group is of the opinion that the steady increase in crude oil prices, while still below the mean average from Q1 2018, will support an upside surprise to the FactSet forecast. Nonetheless, FactSet has further reduced their projections for the Q1 period. FactSet now forecasts Q1 EPS to decline by -4.2% from -3.9% in the previous week. The firm has also reduced revenue expectations from 4.8% to 4.7% revenue growth for the period.
In contrast to FactSet’s forecast, one of Finom Group’s favorite economist and analyst, Ed Yardeni, recently outlined his estimates for Q1 and FY19.
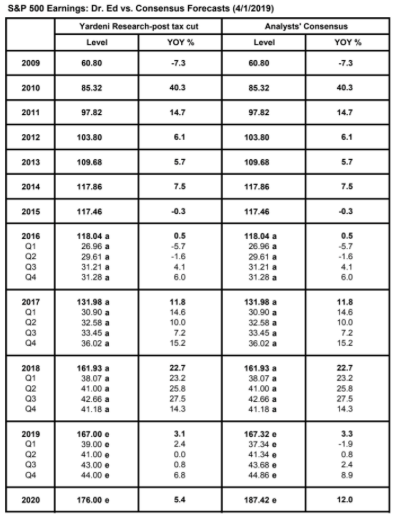
Yardeni Research is forecasting 2.4% earnings growth in Q1, likely indicating or assuming a better than assumed Energy sector reporting season than other analysts and firms. Now let’s take a look at what Thomson Reuters is forecasting for Q1 EPS.
Market Breadth
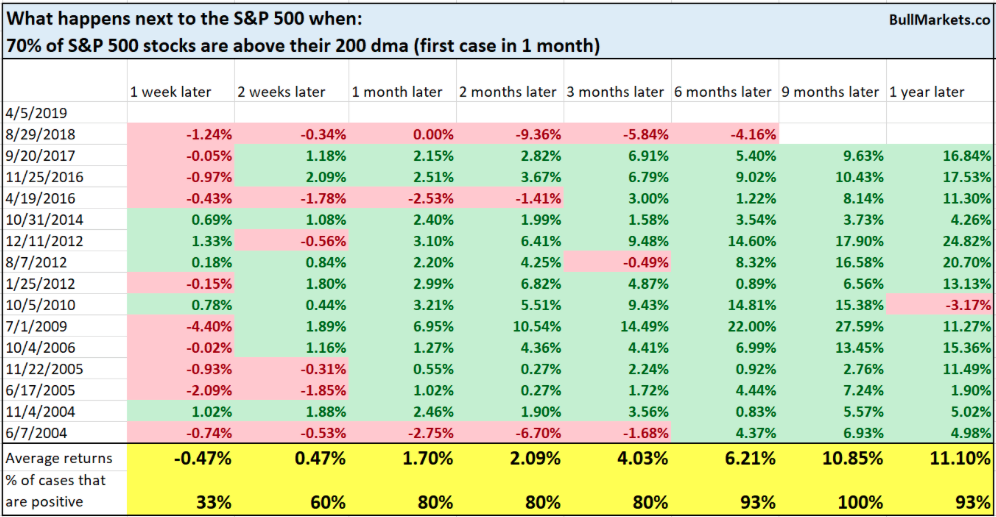
The S&P 500 has recaptured favorable momentum in 2019 and is now up more than 15% year-to-date. More than 70% of the S&P 500’s stocks are now above their 200-DMA’s (breadth). Historically, this was a short term bearish factor for stocks, but longer term this was good for the S&P 500 as shown in the table below. (Table from Troy Bombardia)
Finally, here is Finom Group’s weekend Technical Market Recap with Wayne Nelson. Click the link to review the video! Subscribe today to access all of our research materials that have led to another successful year in managing portfolio allocations, while educating members on all aspects of the economy and markets.