
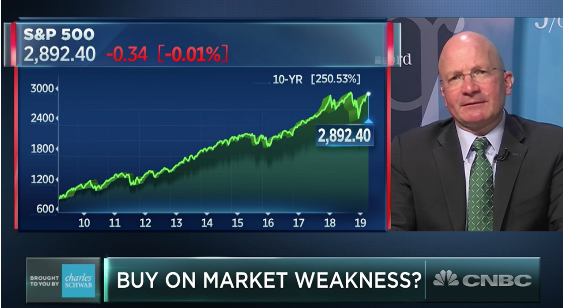
If you haven’t heard by now, the S&P 500 (SPX) is riding an 8-day winning streak, the longest in over a year. The Dow Jones Industrial Average (DJIA) was the lone decliner on the first day of the trading week, weighed down by shares of Boeing (BA) and while the S&P 500 and Nasdaq (NDX) both inched higher. With respect to the S&P 500, the benchmark index is now less than 5 points away from 2,900.
Given the daily winning streak for the S&P 500, we aim to look at this occurrence historically to see how the market performed over the next 12-month period. While the near term results for the S&P 500 aren’t anything to write home about, when you look out some 9 months it becomes clear that strength and momentum increasingly favor the bulls.
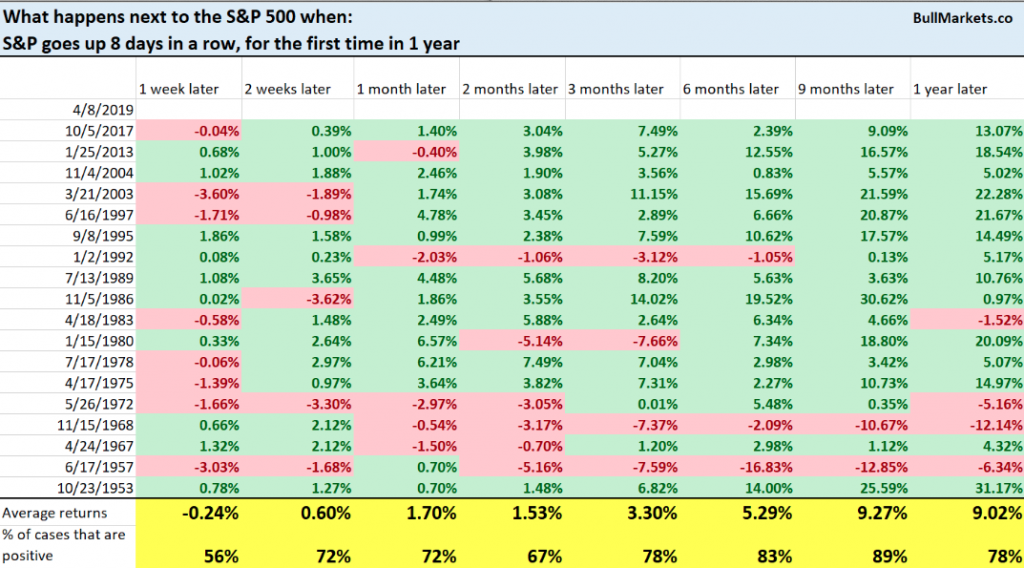
You’re probably asking yourself, “How long can this rally last?” It’s a good question and the answer of course is…nobody knows with any reasonable degree of certainty. Market strength or weakness tends to build upon itself and creates momentum. One thing is for sure and just as it was during the market sell-off last year, overbought conditions can last just as long, if not longer, than oversold conditions. With that in mind, the market hasn’t been this overbought since September 20, 2019.
Moreover, when we take a closer look inside of the S&P 500 and drill down into the sector level, most sectors are/have been overbought.
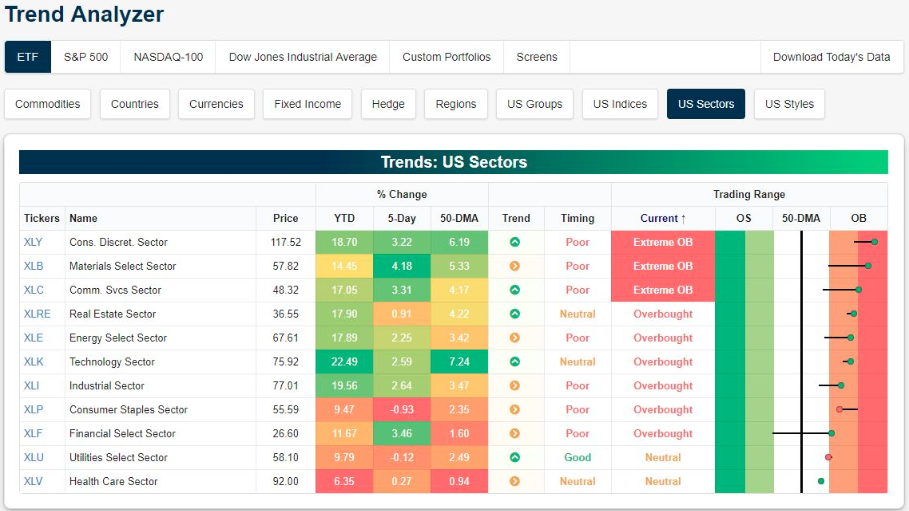
The sectors that were previously the most overbought like Utilities and Healthcare, are now the least overbought and in Neutral territory as shown in the chart above from Bespoke Investment Group. Overbought as the market may indeed be, it has become overbought on very light volume (not atypical), limited exposure from hedge funds and with less than optimistic market sentiment amongst the individual investor.
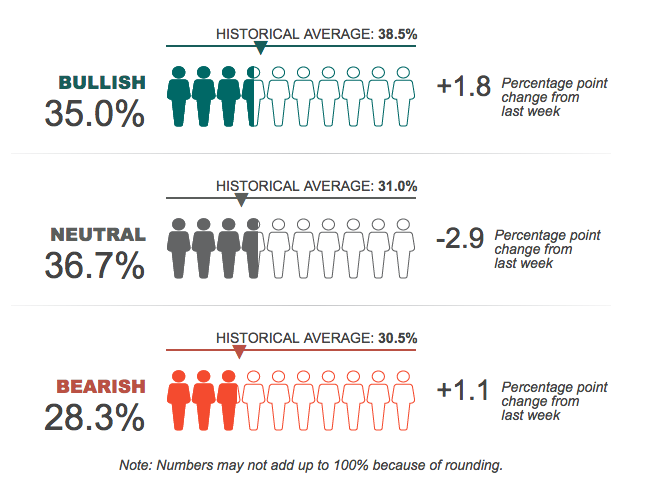
As shown in the American Association of Individual Investor’s survey, the percentage of individual investors describing their outlook for stock prices as “neutral” pulled back after hitting its second-highest level of the year last week. This week’s AAII Sentiment Survey also shows small increases in optimism and pessimism.
Bullish sentiment, expectations that stock prices will rise over the next six months, rose 1.8 percentage points to 35.0%. Optimism is below its historical average of 38.5% for the fifth consecutive week.
Neutral sentiment, expectations that stock prices will stay essentially unchanged over the next six months, declined 2.9 percentage points to 36.7%. The small drop extends the streak of range-bound readings (35.3% to 39.8%) to 10 consecutive weeks. Neutral sentiment is also above its historical average of 31.0% for the 11th time in 13 weeks.
Bearish sentiment, expectations that stock prices will fall over the next six months, rose 1.1 percentage points to 28.3%. This is the eighth time in nine weeks that pessimism is below its historical average of 30.5%.
This week’s special question asked AAII members for their thoughts about Lyft and Uber going public. Nearly two-thirds of respondents (65%) say they would avoid investing in either company. Reasons included the lack of profitability, a general avoidance of initial public offerings (IPOs), not closely following either company, the lack of profitability and both driver and passenger safety issues. Nearly 13% think the stocks could eventually turn out to be profitable investments or otherwise think it was a good idea for the companies to go public. About 4% express concerns that these IPOs could be a sign of the market approaching a top.
We can also monitor how individual investors are positioning from the Investor Movement Index (IMX) tracked by TD-Ameritrade.
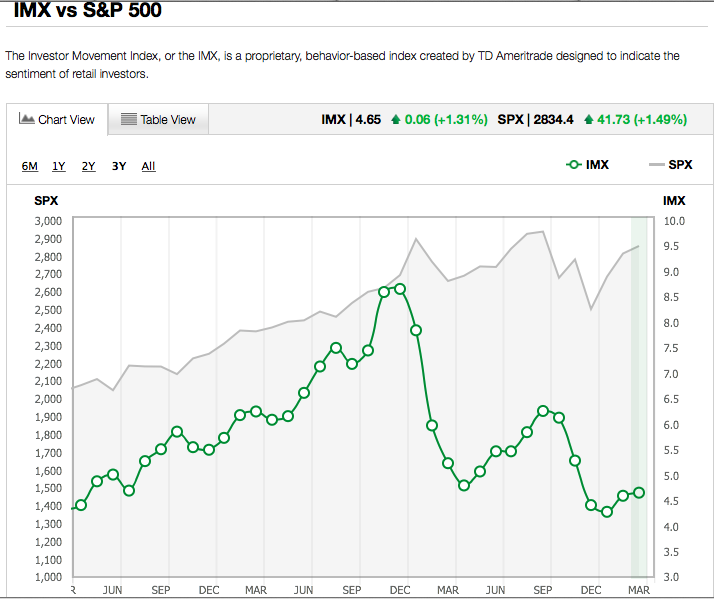
According to the IMX, TD Ameritrade clients increased exposure to equity markets during the March IMX period, with the IMX increasing to 4.65, up 1.31% from the previous period.
TD Ameritrade clients were once again net buyers during the March period. Clients increased exposure to the market, and were net buyers of equities, driving the IMX higher for the second month in a row. Volatility of equity markets was generally light, with the S&P 500 moving +/-1% only three times during the period.
TD Ameritrade clients were net buyers of equities during the period. Electric carmakers Tesla Inc. (TSLA) and NIO Inc. (NIO) were net buys. TSLA saw a volatile month after unveiling the Model Y and announcing dealership closures, then reversing that decision, and was net bought on the weakness. NIO, China’s electric TSLA rival, traded lower after a slowdown in deliveries was greater than expected. Aurora Cannabis Inc. (ACB) was a net buy as the House Financial Services Committee passed a bill to provide a safe harbor for banks that work with the legal cannabis industry. CVS Health Corp. (CVS) announced it would begin carrying cannabidiol-infused products in eight states, and was also net bought. AT&T Inc. (T) was net bought for the third month in a row after announcing a direct-to-consumer streaming service scheduled for later this year. Additional popular names bought include Kraft Heinz (KHC), Twilio Inc. (TWLO), and Ford Motor (F).
Despite being net buyers of equities overall, TD Ameritrade clients found some names to sell. FAANG stocks were popular sells during the period, with all but one being net sold. Amazon Inc. (AMZN) was net sold as the stock reached the highest levels since early December, and was up over 9% during the period following an analyst upgrade. Facebook Inc. (FB) was net sold for the fourth month in a row. The company continues to experience volatility under scrutiny from lawmakers, with the U.S. Department of Housing and Urban Development charging the company with violating the Fair Housing Act late in the period. Netflix Inc. (NFLX), which is up over 50% from December lows, announced it was testing a 250 rupee ($3.62) per month subscription fee for mobile devices in India, and was net sold. Apple Inc. (AAPL) was net sold following a 10% gain during the period as the company announced a new venture into the credit card space. Intel Corp. (INTC) announced a deal with the U.S. Department of Energy to deliver the first exascale supercomputer, and was also net sold. Additional names sold include Wabtec Corp. (WAB), Alibaba Group Holding (BABA), and Twitter Inc. (TWTR).
Switching our focus for the moment; the momentum for the U.S. Dollar (DXY) over the last year (up 7.5% YOY) has been a great concern for U.S. corporations and we’ve offered a good deal of analysis in recent weeks, given the weight applied from the DXY on corporate revenues.
Ali Miremadi, investment director for global equities at GAM recently highlighted the DXY’s strength over the last year and suggested that if the DXY were to weaken it would create a reflating of global asset prices. Some of the factors that have provided the DXY strength over the last several quarters may be coming to an end soon. The Eurozone weakness with its largest economy Germany teetering on a recession and Brexit nearing its deadline for crashing out of the European Union have all found investors flocking to the save haven U.S. Dollar. Should those two variables show signs of improvement and/or resolution, a reversal of trend may very well find the DXY under pressure.
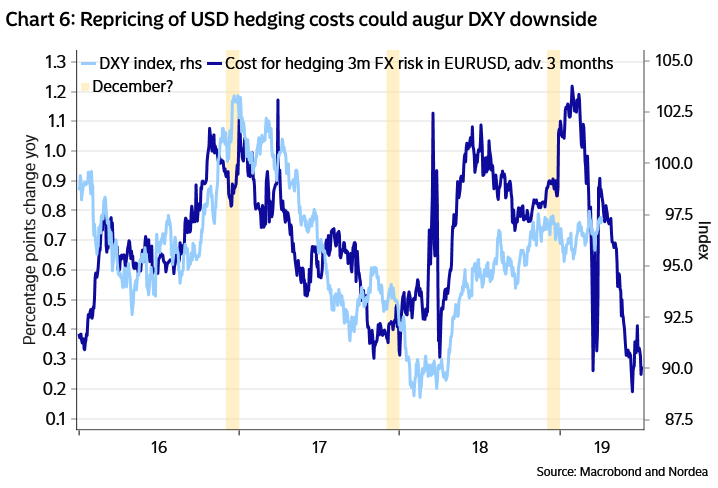
Also and as Nordea writes; the recent plunge in USD hedging costs on the back of Libor-OIS narrowing and the dovish repricing of the Fed, might also indicate USD downside. For some reason, it seems to take 2-3 months before changes to FX hedging costs impact spot developments.
While many investors and analysts rerate earnings, in part based on the strength or weakness of the U.S. Dollar, they do so because some 50% of revenues for S&P 500 companies are derived overseas.
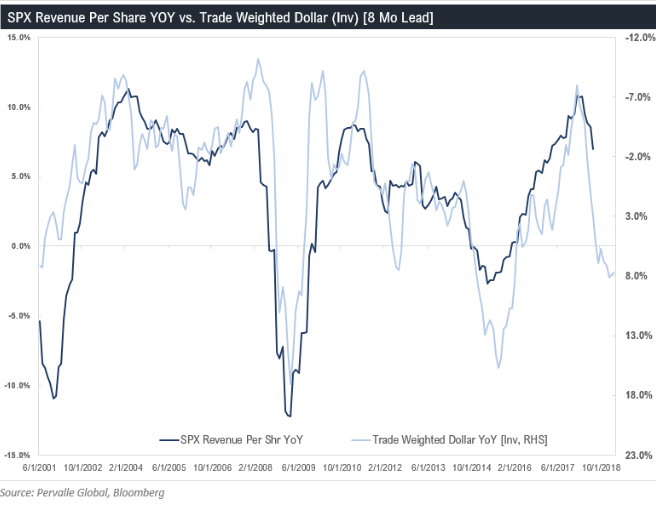
Many investors are also of the opinion this will affect bottom line results/earnings as well. But it’s important to remember that while 50% or S&P 500 revenues are derived overseas, those dollar-weighted sales come with the same dollar weighted costs, which are favorable under the same measure. Said another way, while S&P 500 companies do derive a lot of their revenues and earnings from overseas, they also derive a lot of their costs from overseas. So while a rising U.S. Dollar hurts American companies’ overseas revenues, it also brings down their overseas costs in U.S. Dollar terms. To this point, a rising U.S. Dollar has more of an adverse impact on the S&P 500’s revenues than it does on earnings. Additionally, investors tend to view the impact of a strong currency as transitory and focus on organic sales and earnings. The best way to validate this statement is, of course, with a historical chart of the S&P 500’s movement with the U.S. Dollar rate of change up 7.5% or greater in a year.
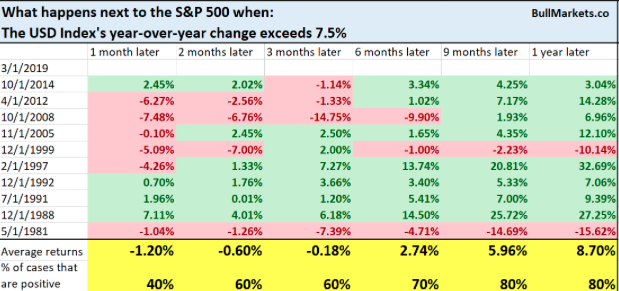
As we can see from the table above, 6-13 months later, the market is much higher even with a strong U.S. Dollar trend. Investors tend to be very forgiving of a strong U.S. Dollar.
Another factor that will affect the upcoming earnings season and likely the S&P 500’s performance is the strength in crude oil prices, which hit a 5-month high on Monday. The price per barrel of light sweet crude is nearly on par with this time a year ago also.
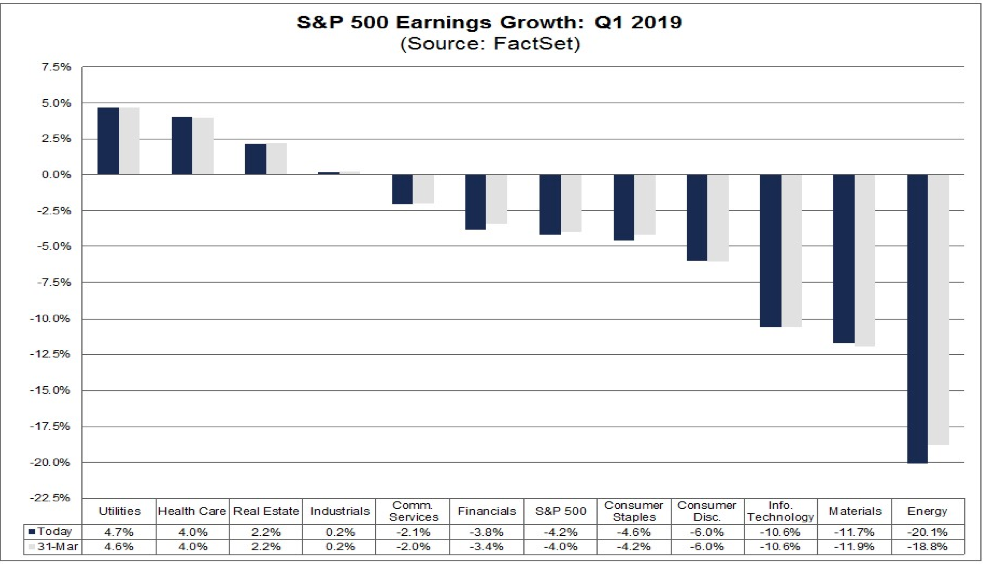
The energy sector is expected to be the worst performing sector in terms of YoY earnings, according to FactSet. In this week’s Research Report, Finom Group offered the following to our subscribing members:
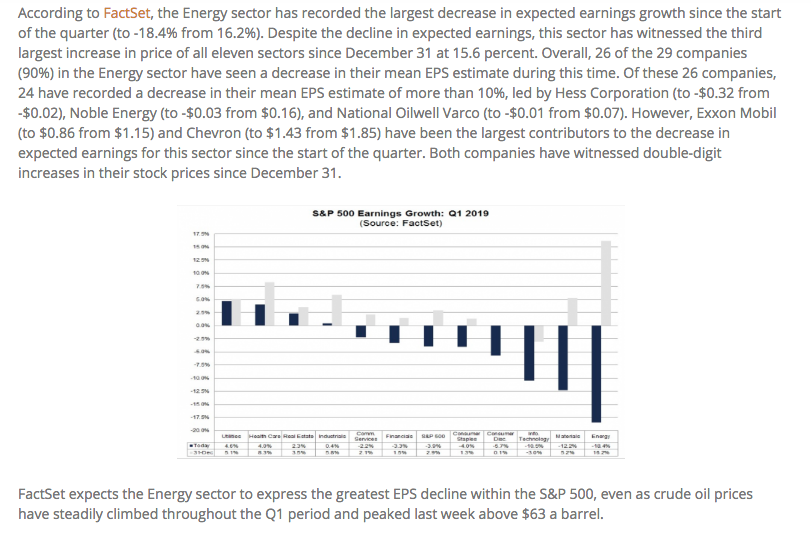
“Finom Group is of the opinion that the steady increase in crude oil prices, while still below the mean average from Q1 2018, will support an upside surprise to the FactSet forecast. Nonetheless, FactSet has further reduced their projections for the Q1 period. FactSet now forecasts Q1 EPS to decline by -4.2% from -3.9% in the previous week. The firm has also reduced revenue expectations from 4.8% to 4.7% revenue growth for the period.”
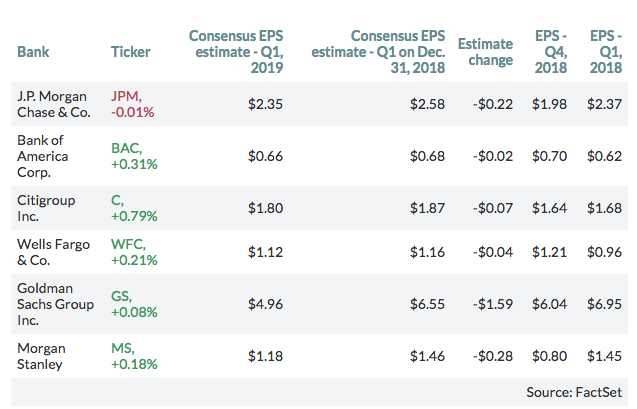
Whether we are proven right or wrong with regards to the energy sector performance and impact on Q1 2019 EPS remains to be seen. In speaking of the upcoming earnings season, however, all eyes and ears will be tuned into J.P. Morgan’s (JPM) and Wells Fargo’s (WFC) earnings releases come Friday morning.
Banking and finance related activities are cyclical businesses engaged in lending and other activities like investment banking, money management, and trading that are always correlated to the strength or weakness of the economic cycle. Now that it appears the economic cycle is in its latter stages, accompanied by slower growth, banks tend to experience lesser demand for their services. Nonetheless, we do recognize that loan growth is still a characteristic of the current economic cycle.
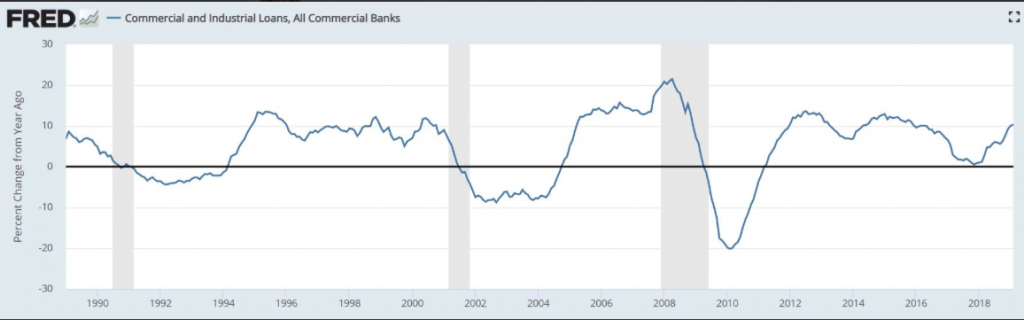
Bank loans continue to accelerate as shown in the Fed’s chart above. The past three recessions saw this turn negative YOY, which suggests the fear of a recession is still not present in most data metrics. Having said that, a more direct focus on loan quality will become important in the latter stages of an economic expansion cycle.
According to FactSet, the Financial sector is expected to express a YOY earnings decline of -3.8 percent.
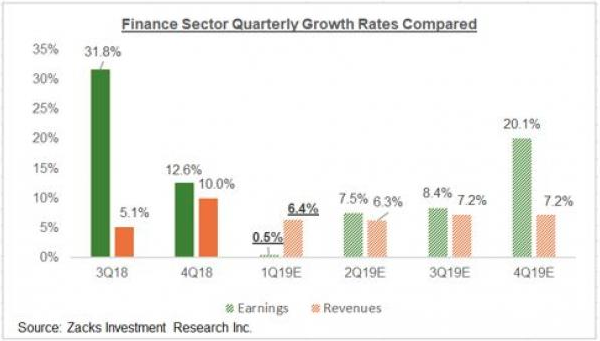
Zach’s Research has a different forecast for the Financial Sector, one that is more favorable. For the Finance sector as a whole (Major Banks industry brings in roughly 45% of the sector’s total earnings), total Q1 earnings are expected to be barely in positive territory, up +0.5% on +6.4% higher revenues. The chart below puts the Finance sector’s Q1 earnings and revenue growth expectations in the context of where growth has been and where it is expected in the coming periods.
Reporting on the big banks more specifically, Jefferies analyst Ken Usdin wrote about “a better setup” for large-cap bank stocks in a report April 1. He did call the picture for the industry “complicated,” and a flat yield curve doesn’t help banks make money. But the Federal Reserve’s support for the economy could help bank stocks in the months ahead, he wrote.
“Valuation is again compelling on its own,” Usdin wrote, because the well-capitalized banks continue to buy back shares, which boosts (or supports) earnings per share, even when the yield curve is flat.”
Below are the consensus first-quarter earnings estimates for the big banks, compared with what they were at the end of December, and to actual earnings for the fourth quarter and the first quarter of 2018:
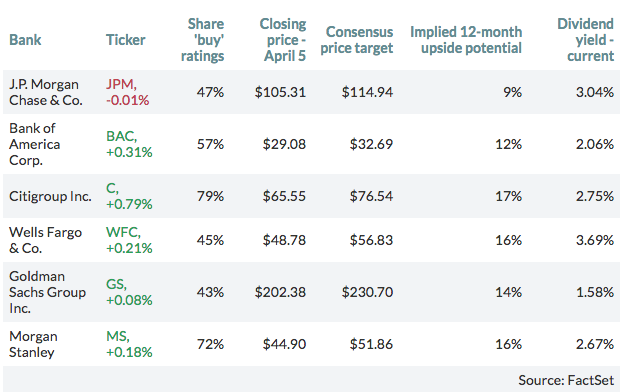
Additionally, here are percentages of “Buy” or equivalent ratings among analysts polled by FactSet, along with price targets and dividend yields for the big six:
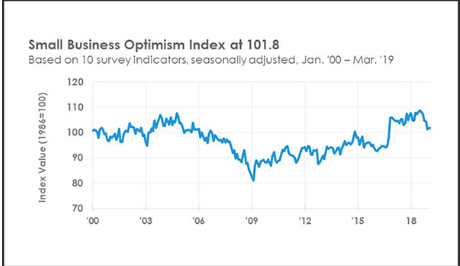
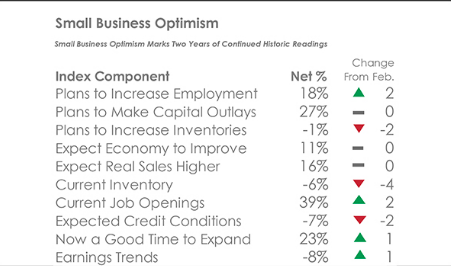
As far as what’s in store for the market Tuesday, we’ll see which way the market’s wind blows and with economic data continuing to roll in. The latest results regarding the health of the small business segment were released this morning. NFIB Small Business Optimism Index increased 0.1 points to 101.8 in March, a historically strong level and an indication that small businesses continue to power the economy after being briefly shaken by January’s government shutdown. Overall, the Index anticipates solid growth, keeping the economy at “full employment” with no signs of a recession in the near term. The Uncertainty Index dropped six points to 79, returning to a more normal level for recent years.
“Owners are growing their businesses and expect that they can sell more if they can produce more with additional employees,” said NFIB Chief Economist Bill Dunkelberg. “Investment spending has been solid for the past two years and owners are choosing to invest in their workforce as well by creating new jobs and raising wages.”
With the probability of an earnings recession in Q1 2019 that results in a trough in earnings, Tony Dwyer of Canaccord Genuity believes that any market pullback of consequence would prevail as a buying opportunity.
Investors have to be careful that they don’t allow the decline from Q4 2018 to pervade their appetite for risk assets in 2019, suggests Dwyer. He’s of the opinion the Fed is providing a more favorable environment for risk assets by taking a Neutral view on rates and the economy. Dwyer doesn’t see the Fed cutting rates without inflation. Lastly, he thinks the biggest risk to the market is if the economy actually starts to reaccelerate above trend growth and is forced to rethink its dovish stance and pivot to a hawkish stance and possibly raise rates. While Dwyer remains bullish on the economy and markets for 2019, other analysts/strategists don’t share the full scope of his views.
Michael Wilson of Morgan Stanley believes investors have become too complacent with the recent rally in the equity market.
Wilson suggests that with Q1 earnings season about to begin, the powerful equity rally will demand a good earnings season coupled with good guidance from those reporting results. Morgan Stanley’s Leading Earnings Indicator suggests FY19 EPS estimates are still too high and guidance should be viewed with a skeptical eye. Wilson expects weaker results will be met with selling pressure and advises investors to reduce equity exposure.


