The market statistics have become more grotesque as October rolls on and with most of the major indices faltering. The Dow Jones Industrial Average dropped 608.01 points at 24,583.42 and erased all of its gains for 2018. The Dow has dropped 7.1% in October. The S&P 500 dropped 3.1% to 2,656.10 and also turned negative for the year. The broadest index is now down 9% from its all-time high. The Nasdaq Composite fell 4.4% on Wednesday to 7,108.4 and entered correction territory.
Housing data released on Wednesday further confirmed the housing market slowdown with New Home sales plunging greater than 5% and to a 2-yr. low. The Commerce Department reported that sales for the month came in at 553,000 on seasonally adjusted basis. That’s 5.5% below the downward revised August rate of 585,000 and a 13.2% tumble from the 637,000 reported for the same period a year ago. September represented the worst month since December 2016. June and July sales rates were also revised lower. New home sales have now declined for four straight months. A decline in median sales price, from $331,500 a year ago to $320,000 now, provided some hope that the market is moderating enough to provide a bottom.
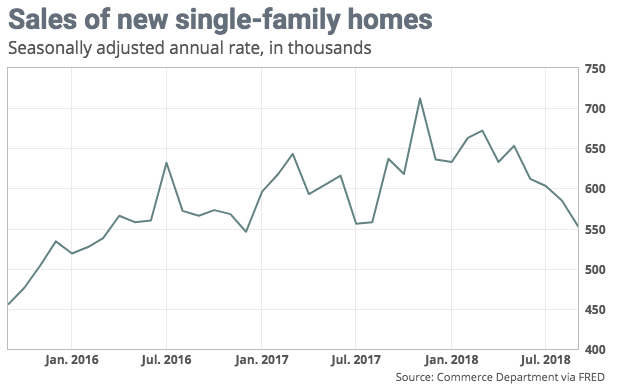
There were 327,000 new homes on the market in September, the most since January 2009 and up 2.8 percent from August. Supply is, however, just over half of what it was at the peak of the housing market boom in 2006. At September’s sales pace it would take 7.1 months to clear the supply of houses on the market, the highest since March 2011, from 6.5 months in August. On the whole and for the year to date, sales are just 3.5% higher than in the same period last year, a measurement that’s been falling steadily throughout the year.
“The September drop likely is due in part to Hurricane Michael, which the consensus seems to have ignored, even though it clearly hit the existing home sales numbers reported last week,” said Ian Shepherdson, chief economist for Pantheon Macro. “We expect a clear rebound in October and then a spike in November, following August’s brief jump in mortgage applications. But the bigger picture is one of a market under pressure from rising rates and the beginnings of a cyclical tightening in lending standards.”
In reviewing the rather poor New Home sales data two things come to mind. 1). Housing didn’t bring the economy out of a recession, as the sales rate is still higher than in 2009. 2). Housing inventory remains subpar and with the household wealth soaring. Essentially, the consumer is healthier and making smarter decisions with their household finances.
Wednesday’s market action finally resembled what many might consider “capitulation”. The Dow was actually down only about 150 points going into the final trading hour. From 3:00 until the closing bell on Wall Street, however, the selling pressure exacerbated and found the major averages closing on the lows of the session with increasing volumes. Such activity identifies capitulation or a puking of equities, as it’s also known, whereby both good and bad equities are cast aside in favor of risk-off holdings, cash. Does this mean the selling is over and the bull market now resumes? That’s probably the wrong question to be asking and less relevant long-term. For now, fear is definitively palpable in the market and reaching its peak.
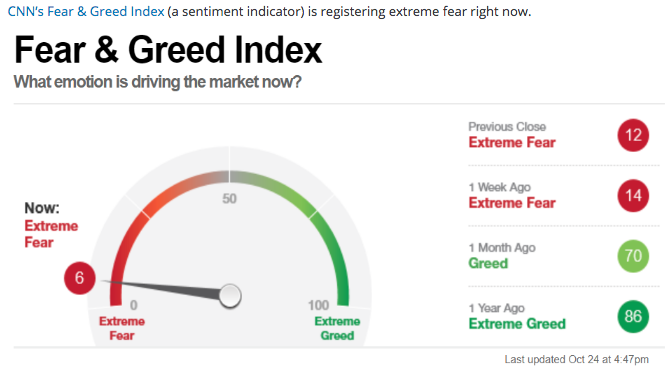
Alongside CNN’s Fear & Greed reading, the VIX is also registering higher levels of fear in the market as the fear gauge tipped over 25% on Wednesday. One of the variables that Finom Group’s chief market strategist looks for in order to identify peak fear is not just the VIX reading, but through CNBC’s programming schedule. Here’s what Seth Golden had to offer in a recent conversation with investors.
“I don’t think yesterday’s puking was the be all and end all of the current sell off, but I do believe it provides for a tradable bounce. Whenever CNBC has a 7:00 p.m. “markets in turmoil” program it usually signals a near term bottom. They do this every time the market has successive market declining days of magnitude.
This is going to take some time to muddle through for investors, just as it did in February. We’ve got a crosscurrent of headwinds and tailwinds to consider and it’s creating uncertainty. There’s very little the market likes less so than uncertainty.
One of the determining factors in weighing how the market will perform going factor has come into question and that’s a problem. Earnings growth for 2019 has come into question due to the Fed’s determination to continue raising rates, Trump’s tariffs and a slowing global economy. Earnings are forecasted to grow some 10% in 2019, but with interest rate sensitive industries already under pressure, it’s a growing concern that the current market multiple is too high, as earnings expectations might be too high.
I think some of the growing concerns are misplaced and where there is economic pressure it will likely be met with policy change and/or regulatory changes. Certainly such actions are double-edged swords, but there’s no political willingness to suffer an economic downturn and we’ve seen this since 2009.
All in all I think much of today’s fears are normal and what we contend with for every market sell off. We all want the market to pullback when it keeps trending higher, to buy those stocks we now know are performing, but when the sell off comes we blind ourselves from that previous desire for a pullback with dire considerations for the future. Worst case scenario I think is the market WANTS a February low retracement, but it’s hard to imagine that happening given what that PE would look like and with corporate earnings still growing above 20 percent. Most reporting companies are suggesting the remainder of 2018 having strength on scale with much of the year that has passed and without faltering guidance for Q4 2018.”
The market sell off has found equities more attractive of late. The S&P 500 12-month forward looking PE ratio is now right around 15.2%, having come down from over 16.5% in the early fall months. This P/E ratio is below the 5-year average (16.3) but above the 10-year average (14.5), according to FactSet. A retracement to the February 2018 lows, which Golden hinted at, would take the 12-month forward PE ratio below the 10-year average. This with GDP still expected to grow in the 3% range for 2018.
The biggest data point of the week is still to come in the way of Q3 2018 GDP on Friday. The median forecast for Q3 GDP, according to CNBC’s Rapid Update is shown below.
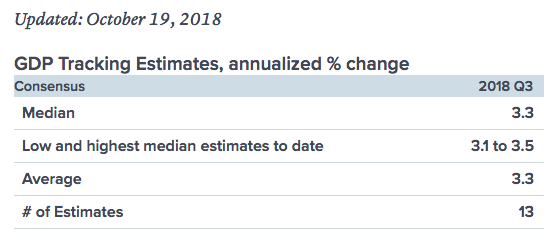
The Atlanta Fed GDP NowCast forecasts Q3 GDP to come in at 3.9 percent. Rounding out some of the forecasts, a survey of economists polled by MarketWatch suggests Q3 GDP to come in at 3.4 percent.
While investors have seemingly brushed strong earnings aside since the onset of the Q3 reporting period, they remain a focus long-term. Some key tech earnings are due out today after the closing bell that may go a long well toward quelling the market’s fears. Before the opening bell on Thursday there are numerous companies reporting from various industries as shown in the screenshot below.

With a slew of reports happening before the market opens, investors are still mostly concerned with the reports coming after the close on Wall Street. Amazon (AMZN), Alphabet (GOOGL) and Intel (INTC) will remain top of mind with investors throughout the trading day, as they report after the closing bell.
For the sake of brevity and likely where most investors will turn their eyes and ears toward after the closing bell, here is what analysts are expecting from Amazon when it reports. Amazon is expected to report earnings of $3.08 per share, including Whole Foods Market, according to the FactSet consensus, up from 52 cents per share last year. FactSet analysts expect revenue of $57.11 billion, up from 43.74 billion last year.
If investing and trading were easy, everyone would be doing it, right? Unfortunately, that is not the case and it takes strong disciplines and experience to perform well as an investor over time. The market rarely does what one thinks it is going to do in the near term. In the early morning hours, we’re not seeing continued selling pressure, but are met with a modest futures rebound, pointing to a 1% rise on the Dow. Having said that, it remains a long day ahead of investors with many variables that can impact the market. The European Central Bank is one of those variables that have the ability to affect global markets. The ECB will release its policy statement at 7:45 a.m. Eastern Time followed by a news conference hosted by its president, Mario Draghi, at 8:30 a.m. EST. In the U.S., pending home sales, weekly jobless claims and durable goods orders will highlight the daily economic data calendar.
As it was in February when the market sold off, it is with the current market sell off, we leap to the worst -case rationale for the markets sentiment and activity. It remains to be seen if this time is any different and with growing fear in the market. There’s no need for traders to be heroes of the market in the near term. The market is lacking support presently, but some support will be forthcoming as the blackout period for buybacks eases next week.
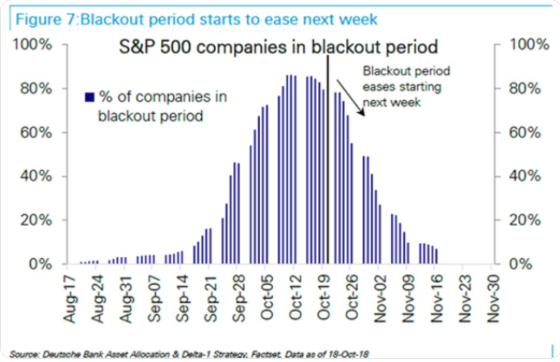
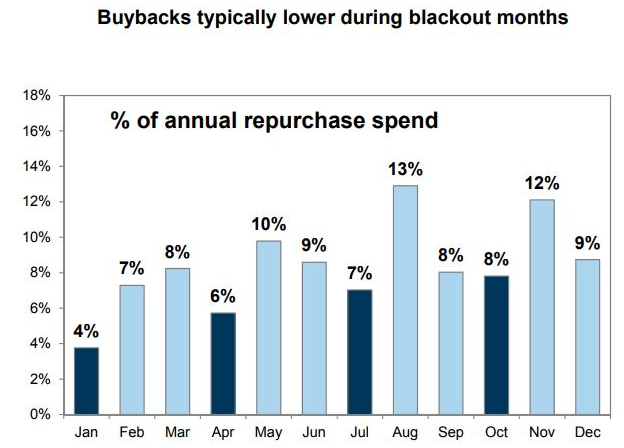
One of the reasons October tends to be a less than optimistic and poor market-performing month historically and when compared to other months is due to blackout periods. Late-September to the end of October is the blackout period for stock buybacks. A blackout period = 5 weeks before an earnings report during which companies typically don’t buyback their shares. It’s a widely popularized falsehood that companies aren’t allowed to buyback their shares during this period.
“Under a separate SEC rule, companies can do a share repurchase program even during a blackout period. This separate rule (it’s called Rule 10b5-1) permits trading during the blackout period providing the companies have set up a plan to buy back stock on a regular, defined basis.”
While the details of the blackout period are misunderstood, the reality is that most companies simply abide by it, as they don’t desire to go through the exercise of the necessary filing. The blackout period for buybacks has been more broadly popularized by the lacking of buyback activity during such periods. The chart below identifies blackout period activity historically and on a monthly basis.