Everyone and I do mean everyone has their eyes, ears and whatever other body part tuned into the bond yield curve (YC). The following intraday chart identifies the movement of the S&P 500 (SPX) and 10-yr. Treasury yield (TNX) for March 27, 2019. (Blue = SPX, pink = TNX)
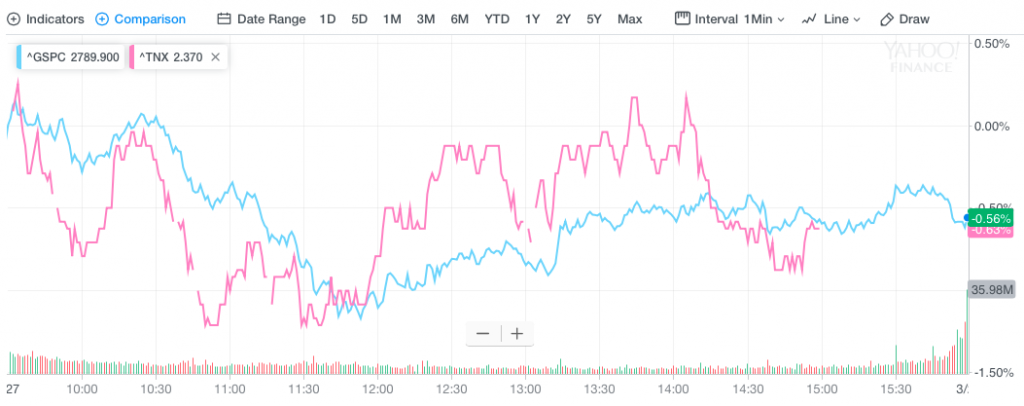
With the near dated end of the YC inverted for 4 days now (3mth/10-yr) investors have paid particularly close attention to all things YC related. For most every tick higher in the 10-yr. Treasury yield the SPX also ticks higher and for every tick lower in the 10-yr. Treasury yield the SPX ticks lower.
With economic conditions slowing around the world, a global frenzy for yield continues. U.S. Treasury yields fell on Wednesday as Mario Draghi made dovish comments suggesting more easing measures likely to come from the ECB in response to recent weakness in the economic headlines. Draghi’s comments sent U.S. Treasuries rallying again, sending the yield on the 10-year to 2.35% and pushing the yield curve further into inverted territory at negative 9 basis points on the 10y/3m curve Wednesday.
Equity markets finished in the red again on Wednesday, with the Nasdaq (NDX) leading the decline. The S&P 500 finished lower by nearly a half percent while the Dow outperformed, finishing lower by only .13% on the day, as a late day rally in shares of Boeing (BA) helped to lift the index into the closing bell.
As the YC inversion subject has carried on throughout the trading week, we now aim to review how individual sectors performed when the YC last inverted in 2006 and prior to the Great Financial Crisis. (See sector table below from Bespoke Investment Group)
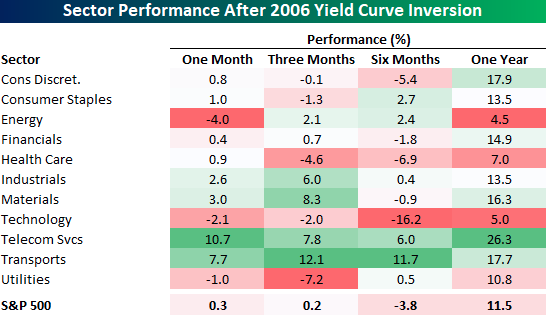
The 2006 inversion was followed by mixed market returns. One month later, the S&P 500 was essentially flat with Telecom Services and Transports leading the way higher as Energy and Utilities both declined. Three and six months later, the S&P 500 saw similarly mixed returns, but one year later, the S&P 500 was up over 11% and every sector was up at least 4.5 percent.
Despite the sideways market action this week, many of the individual market sectors remain in overbought territory. Of course, of those many, the financials is not one. Financials have taken a beating with yields dropping sharply over the last couple of months.
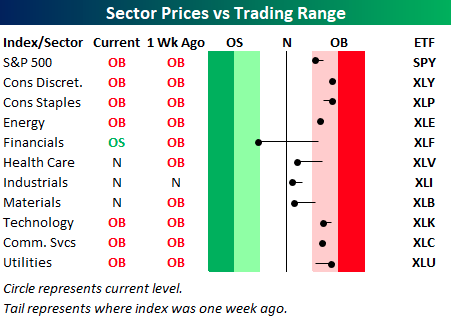
Financials have been hit hard and is not only the only sector trading below its 50-DMA, but it is also the only oversold sector. If there is one sector where the pain of an inverted yield curve was immediately felt, it was in the Financials!
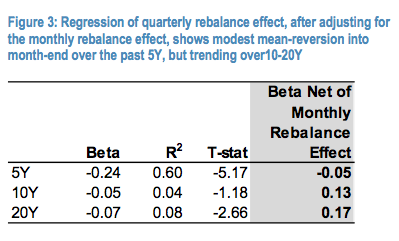
As the market edges closer to the end of the Q1 2019 period, many fund managers are chasing yield and overall performance, with the S&P 500 up double-digits year-to-date. This lends itself to the conversation centered on quarter-end rebalancing for fixed weight portfolios. Fixed weight portfolios can rebalance based on market triggers or specific calendar dates. Calendar dates often implemented are month-end, quarter-end, semi- annually or annually. Each of the frequencies has differing prevalence and hence market impact. We find the strongest effect is on monthly rebalance dates. The reason for this is that the monthly rebalance effect is reinforced by option expiry effect. In fact when one looks at quarter-end effects, and corrects for month-end effects, the quarterly impact is fairly weak in recent years (about one quarter of the monthly effect over the past 5 years). If one looks at longer histories, i.e., 10 or 20 years, the quarter-end effect does not exist at all (i.e., it goes the other way, see table below). Given that the market is up a lot since December-quarter-end, but is not up much on a month-to-date basis, we expect fixed weight portfolio rebalances to have only a small negative effect on the overall market. Historical analysis would imply a less than ~50bps negative market impact from these rebalances.
Before we discuss the top trending story of the day, U.S./China trade talks, let’s also take a look at some of the more important measures of economic data released on Wednesday that actually correlates to trade talks. The trade deficit shrank 15% in January after soaring in December, a surprisingly large swing that reflects how much the trade standoff between the U.S. and China has disrupted the flow of goods and weighed on the economies of both countries.
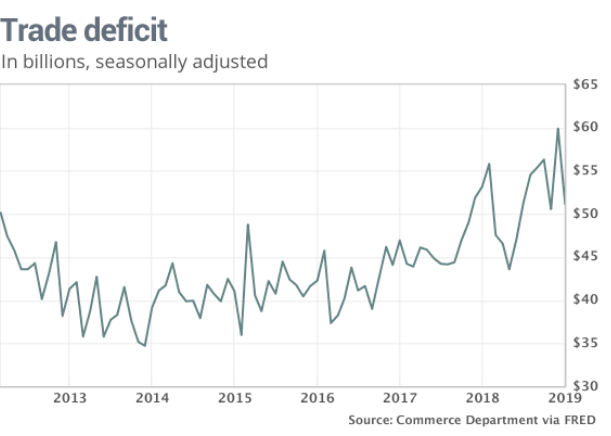
The deficit shrank to $51.1 billion in January from almost $60 billion in December, the government said Wednesday, largely because of cheaper oil, surging soybean exports and lower Chinese imports.
Imports rose for the first time in four months, but barely so. They edged up 0.9% to $207.3 billion, the Commerce Department said Wednesday. Soybean exports soared to $1.21 billion in January from less than $300 million in December. They were also up almost 50% compared to the same month a year earlier.
Imports slipped 2.6% to $258.5 billion in January, marking the second decline in a row. The cost of imported oil fell to the lowest level in three years, reducing America’s foreign energy bill. The U.S. also imported fewer computers and semiconductors.
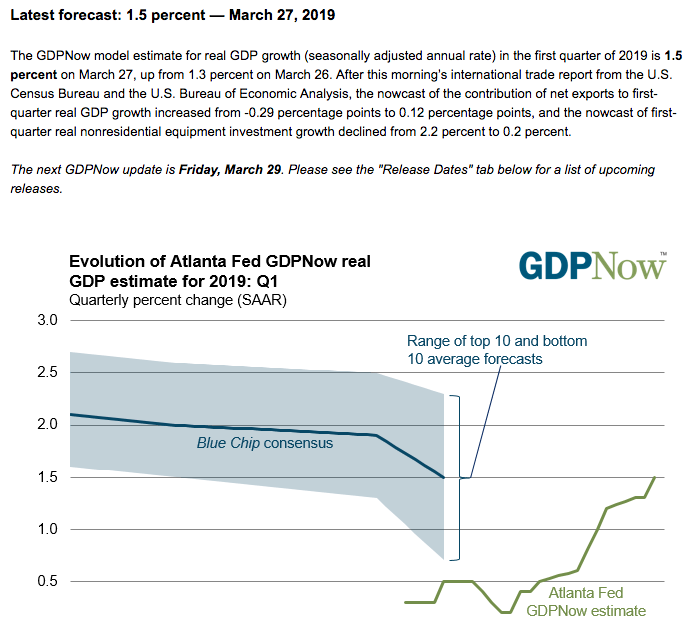
With the trade deficit narrowing, the Atlanta Federal Reserve has further revised its Q1 GDP forecast higher. Only two weeks ago, the GDPNow forecast was .3 percent. As shown in the chart below, it has risen to 1.5% as of Wednesday’s revision and will undergo another revision on Friday, post the Personal Consumption and Expenditures (PCE) data, which is the FOMC’s favored tool for measuring inflation.
Speaking of inflation…Kansas City Fed President Esther George on Wednesday said she’s not worried about the inflation outlook and doesn’t see the need to overhaul the central bank’s policy of aiming for a 2% annual inflation target.
“The current outlook for inflation appears to be benign, and I consider the recent behavior of inflation to be broadly consistent with our price stability mandate,” George said in a speech prepared for delivery to The Money Marketeers of New York University.
Despite all the geopolitical and macro-fundamental concerns, the market has basically gone nowhere for a few weeks now. There’s essentially been a good deal of chop.
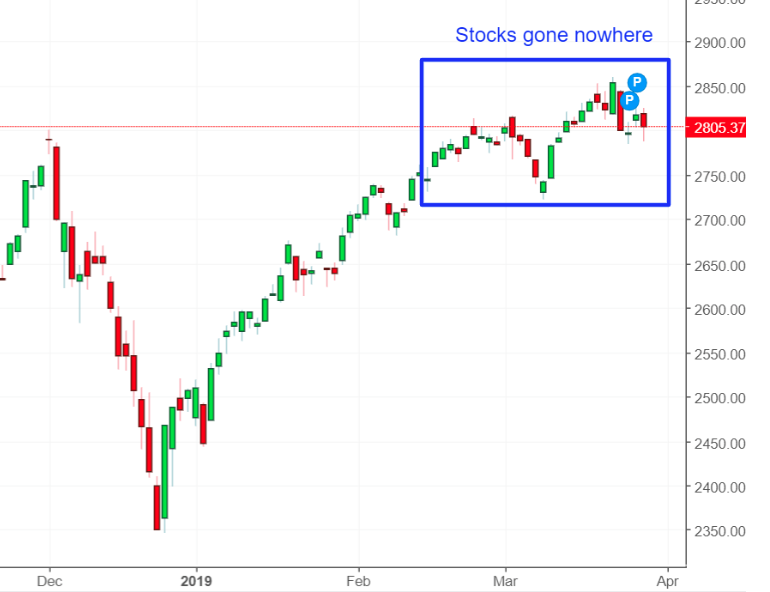
Nonetheless, the media circus continues to proliferate headlines on a daily basis. If it’s not trade talks or Brexit, it’s the yield curve. When is the recession and when is the market going to peak or has it peaked already? Given all the headlines and compounding the headlines with the yield curve inversion, it’s somewhat remarkable to see the volatility index still below 16% (indicating 1% daily SPX moves). Heading into the Wednesday trading day, the Put/Call ratio for the VIX was under 20% for the third straight day. The only other time we had seen it below 20% for 3 consecutive days was back in mid-October 2017.
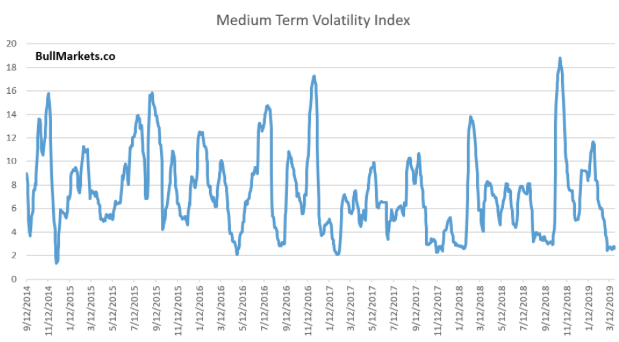
Undoubtedly, there’s been an uptick in volatility, as gauged by the VIX, over the last several trading sessions. Wednesday alone saw the Dow decline by as much as 232 points before finishing the day down less than 40 points. Nonetheless, the VIX has moved into a lower level regime in Q1 2019 when compared to Q4 2018.
According to a recent study by Bullmarkets.co, low volatility is often short term bearish, but it is bullish 6-12 months later for stocks. Why? Because:
- The final 6-12 months of a bull market are often extremely choppy. In other words, the final rally is usually accompanied by higher volatility.
- Bear market rallies are usually also extremely choppy.
Here’s what happens next to the S&P when our Medium Term Volatility Index is under 3 for 16 consecutive days (i.e. is very low)
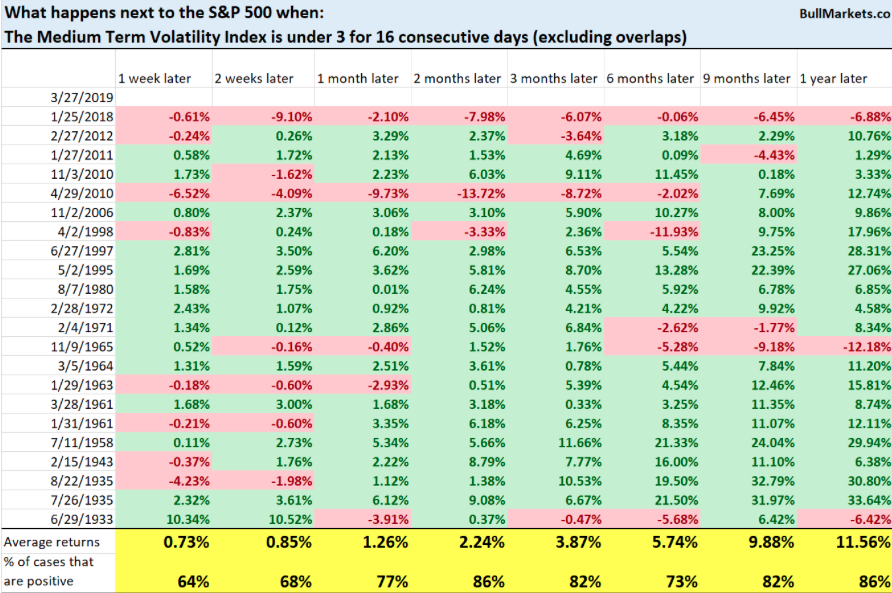
It’s quite clear from the table above, the stock market’s 2-12 month forward returns are more bullish than bearish, but we would also note that history does not always repeat. And now for the biggest headlines of the day.
China has made unprecedented proposals in talks with the United States on a range of issues including forced technology transfer, according to Reuters. China put proposals on the table in the talks with U.S. trade officials that went further than in the past, including on technology transfer, said one of four senior U.S. administration officials who spoke to Reuters.
“If you looked at the texts a month ago compared to today, we have moved forward in all areas. We aren’t yet where we want to be,” the official said, speaking on condition of anonymity.
They’re talking about forced technology transfer in a way that they’ve never wanted to talk about before – both in terms of scope and specifics.”
In addition to opening the dialogue around forced technology transfer, or outright theft of IP as the U.S. sees it, China will sharply expand market access for foreign banks and securities and insurance companies, especially in its financial services sector, Premier Li Keqiang said on Thursday.
Li said the business scope of foreign banks, as well as market access for credit rating companies, bankcard settlements and non-bank card payments, will all be “expanded sharply,” with restrictions on the scope of foreign securities companies and insurance brokers expected to be removed.
“Such measures will be implemented this year in a relatively forceful way,” he said.
Ahead of the market’s open on Thursday and with the expectation of a 2nd look at Q4 2018 GDP, investors are still grappling with the latest developments on Brexit. Tomorrow is the Brexit deadline and the big guns are coming out that include Prime Minister Theresa May offering her resignation once a Brexit deal is delivered. Assuming something positive develops on the Brexit front within the next 24 hours, the equity market could be primed for another leg higher. Of course if nothing positive develops…always consider both sides of the Brexit coin folks.
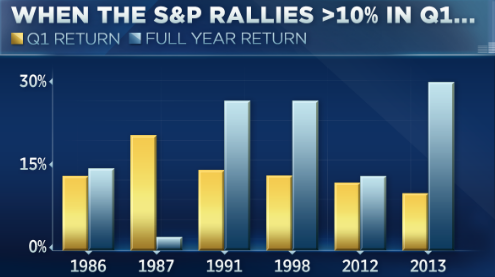
Moreover and with respect to the quarter’s end, the S&P 500 is on track for its best quarter in a decade, up roughly 12 percent. In nine of the 10 previous times since 1950 that the S&P returned more than 10% in the first quarter, it went on to post double-digit gains for the year, according to LPL Financial’s Ryan Detrick. The one exception was 1987, when the market crashed on Black Monday.
While indeed Q1 has been kind to investors, the yield curve inversion suggests the clock is ticking before an inevitable recession is found. Not everyone believes the current yield curve inversion is the predictor it has been in the past. Tom Lee, head of research at Fundstrat Global Advisors, made offered the following recently on CNBC:
“I know the yield curve’s inverted, but the front end is like Chicken Little. It has inverted as early as four years before a recession. The real curve to watch is the 10-Year/30-Year, and that’s been steepening. So it might be too early for people to get neutral. And then we did a report last week to show that there’s a lot of indicators that show we’re mid-cycle in the U.S. […] I think it’s contrarian to say we’re mid-cycle, but if you look at employment-to-population [ratio], usually, it peaks at 64 percent. That’s 10 million more jobs, or about 300,000 a year for three more years. ”
Bespoke Investment Group co-founder Paul Hickey, for one, said the significance of the inversion will depend on how long it lasts:
“The importance of the yield curve is how long are we going to be inverted for? […] The longer you have this situation, the higher the risk goes. I think if we can go a few days inverted and then start to steepen again, I don’t think the concerns are as worrisome. … Our big area of focus is the semiconductors, and they’ve been a great leadership [group] for the market overall over the last six years. Every major sell-off in the stock market has been preceded by underperformance.”
And with that folks, we are set-up for another trading day. Please review our daily Technical Market recap with Wayne Nelson by following the link.