
There’s so much to discuss as it pertains to the current S&P 500 (SPX) rally and the Alphabet. No, not just Alphabet’s (GOOGL) earnings, but 3 letters of the Alphabet that serve as signal posts for the S&P 500: E-F-G baby!!
- E-arnings
- F-ederal Open Market Committee
- G-lobal Trade
EFG will be the acronym of 2019 if, and only if, the markets rise from the ashes of Q4 2018 and achieve new all-time high levels. So with that being proposed we can’t help but to recognize that the markets are largely overbought. Having said that and akin to oversold conditions in Q4 2018, markets can remain at extremes for longer than investors/traders realize. Oversold conditions lingered in Q4 2018 for over two weeks. Overbought conditions have only presented themselves in the last few trading sessions.
One of the ways in which we define the market as being overbought refers to the percentage of individual stocks that are above their 50-DMA. Another way we can define overbought conditions outside of individual stocks is by looking at index funds. Bespoke Investment Group has an interesting table that looks at such index funds with guarded inputs such as the 50-DMA. (See Table Below)
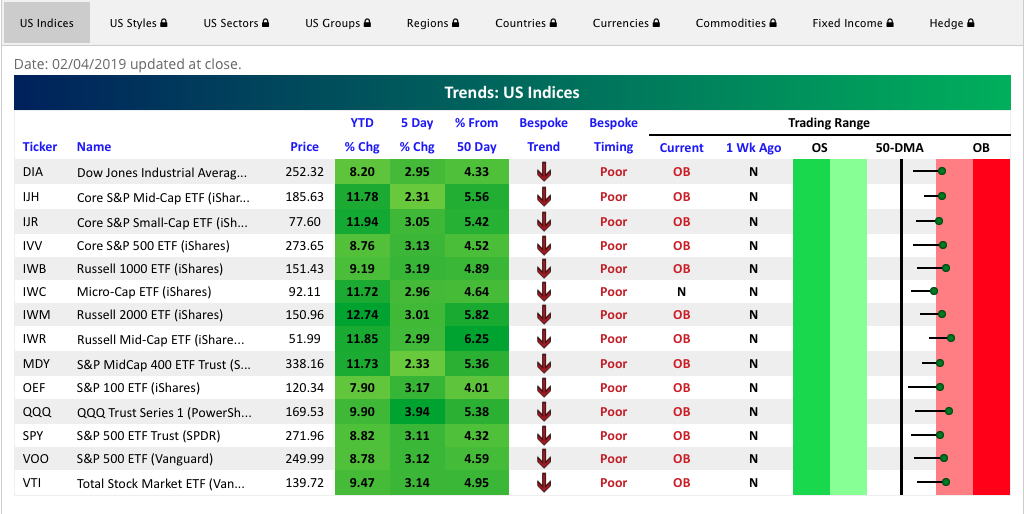
As shown in the table, pretty much every index fund is now in or teetering on overbought territory. Only a week ago they were in neutral territory. And look at those year-to-date changes in value!
Typically, what we would expect near-term is some level of give back in the index funds and market as a whole. How much give back remains the question of the day? But is there another question we should be asking ourselves? Certainly the following chart begs of us to ask whether or not the market will deliver a pullback or some degree of retesting lows or if we’ll witness a rarity in the markets, a V-shaped bottom.
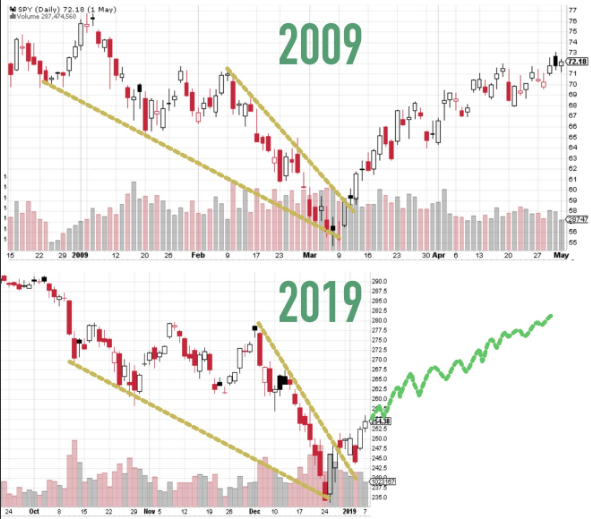
The chart above of the Spiders S&P 500 ETF speaks volumes. The top chart depicts the last V-shaped bottom that occurred in 2009. It looks eerily similar to the chart on the bottom of the late 2018-2019 period. We won’t now how this all shakes out for several months, but investor interests have been peaked once again. Speaking of peaks, look at the S&P 500 Relative Strength Index (RSI).
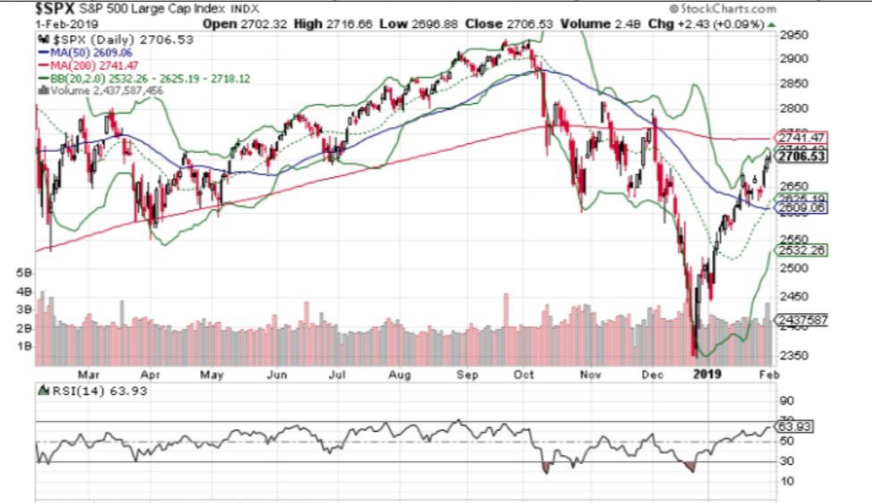
The current reading of right around 65 RSI is not altogether high, insinuating that either the rally lacks a great amount of participation or belief or it has room to melt-up.
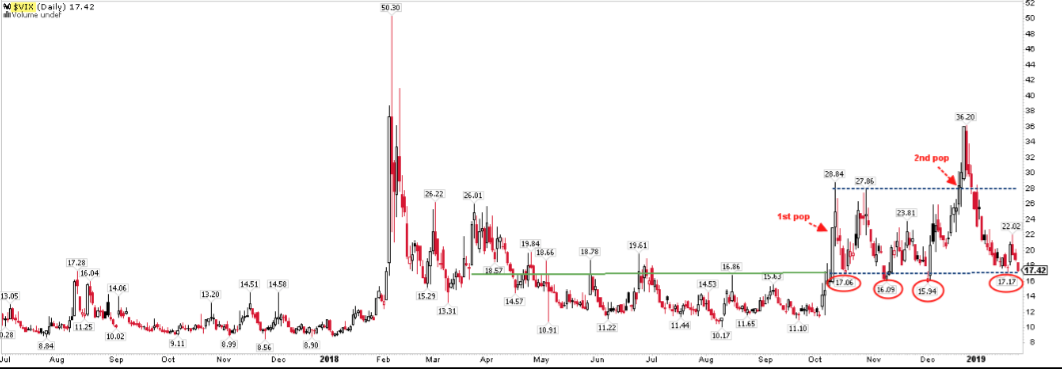
As the S&P 500 and its peer indices have rallied 15% and more off their Christmas Eve lows, the VIX and market volatility have been absolutely “crushed”, to use VIX terminology ever so crudely. From a peak of VIX 36 in December, the index has fallen below its 200-DMA and to lows not seen since early December (low of 15.94). Monday also marked the first time the VIX closed beneath 16 since 10/09/18. Something else of interest to consider…
We’ve discussed in the past the seemingly disconnected VIX-VVIX ratio. VIX call options have been very much out of favor of late and evening through the worst parts of the S&P 500 decline in December 2018. The Volatility of Volatility Index-VVIX has been in steady decline over the last 6 weeks and creating this unusually low VVIX value when compared to the VIX of late. In fact and as shown in the VVIX chart below, we haven’t seen VVIX this low since July 2017.

Even after the February 5, 2018 “Volpocalypse” event, VVIX did not decline to the same degree that we’ve seen during the current correction period. And this with VVIX ascending that much more during the Volpocalypse. VVIX might be telling investors something about the recent technical bear market that we simply won’t be able to conclude upon until the future. Whereas VVIX tends to lead the VIX, directionally, maybe it is also leading the market directionally with regards to market complacency–total returns FY19. And speaking of Volpocalypse, HAPPY ANNIVERSARY! Well, probably not so happy for many who felt the tremendous losses during that period whereby the VIX rose more than 100% in a single day on February 5, 2018. In looking back on the Volpocalypse, Vance Harwood of Six Figure Investing offers his thoughts on what caused the event last year.
“In the afternoon of February 5th, 2018, what looked like a bad day for a group of high flying volatility-based products turned into a devastating decline. Four factors combined to ruin their day:
- A Flawed Architecture
- Relying on the Past to Predict the Future
- Billions Under Management
- A Record-Breaking VIX® spike
Harwood goes into great details with regards to what caused that infamous day within the market and volatility-trading complex. The best way to more plainly describe what happened can be seen in the following chart that shows the top ten VIX intraday spikes compared to the SPVXSP index (VIX future based) on the same days in historical order.
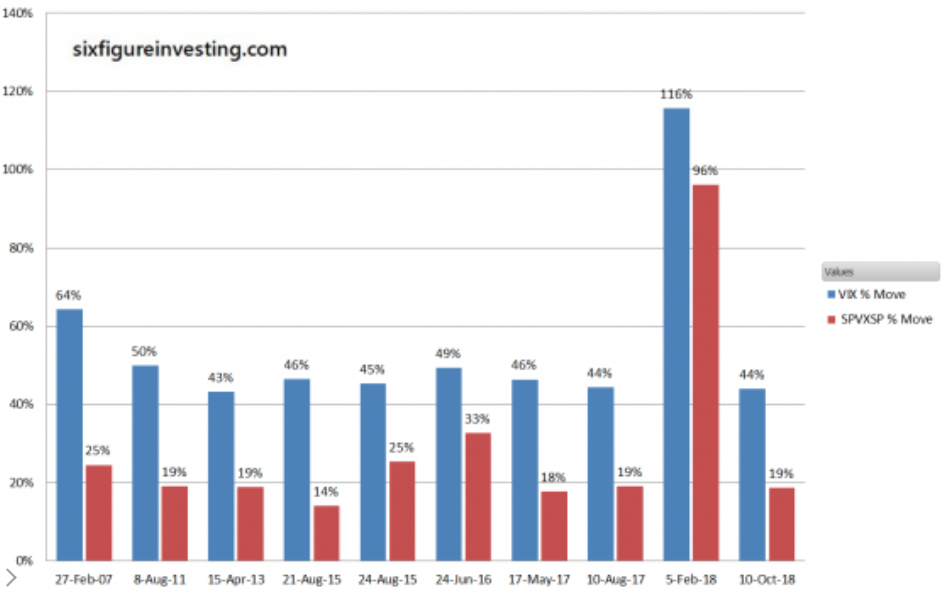
Obviously, February 5, 2018 found the VIX soaring, only to find VIX-ETPs forcibly reacting in kind to the move given their VIX futures based assets under management comprising the Exchange Traded Note or Fund.
Finom Group and Seth Golden have promoted, for years, the understanding and acceptance that trading volatility demands of itself macro-economic considerations. We’ve suggested this given the unusual set of circumstances that relate to the ever-evolving nature of market volatility. Moreover, volatility has a natural expression of regime change that is ongoing and eternal. The markets move from one volatility regime to the next and so on and so forth. Since the Great Financial Crisis and the presumed “Fed Put” emerged from the Crisis, volatility has maintained a prolonged period of suppression or market complacency that morphed itself into expressing a record low VIX reading in late 2017, also forecasted by Seth Golden. But as we reflect on Volpocalypse and its causes we can’t help but to rationalize the element of short-VOL participation rate of change. Shorting market volatility had increased in popularity year-after-year and peaked heading into February 2018. Simply put, short-VOL became increasing popular and an increasingly crowded trade, lending itself to a natural contributing factor of the Volpocalypse.
In foreseeing the potential for calamity within the short-VOL trade, Seth Golden wrote a free publication in November of 2017. The title of the article was Short Volatility Strategies And A Word Of Caution. Within the article Seth Golden offered the following:
- For fiscal 2017, the VIX itself will possibly maintain a mean average below 15, something previously unheard of and certainly not within the realm of any one’s forecast. This year will prove to be quite the anomaly for the equity markets and volatility.
- Day in and day out I see, hear about and am personally confronted with new traders and investors desiring to dip their toe into the volatility pool. That’s what a sub-15, mean VIX reading will do after all; it can lure the unsuspecting, lesser informed and those lacking experience into an environment of decisive calamity that they have yet to fully understand and appreciate.
- I’m concerned by what I encounter as I foresee a time where such complacency may be met with…well greater volatility for which greater expertise and even timing may be necessary to extrapolate profits from the volatility trade. Timing will be of even greater need for those who participate with instruments like VelocityShares Daily Inverse VIX Short-Term ETN (XIV) or ProShares Short VIX Short-Term Futures ETF (SVXY). These instruments are not double-leveraged and fail to achieve the same benefits that other 2X VIX-ETPs benefit from like a greater degree of options decay, contango and beta friction. SVXY and XIV can be marred during and after a VIX spike by beta slippage. If you don’t time your long participation with these instruments properly in an otherwise elevating or elevated VIX environment, it can take a longer time than realized for these instruments to rebound to prior levels.
- I see a good many newly positioned short-VOL strategies in the market and among the trading population. Many of these strategies, I would certainly offer, are ill advised and lack a necessary caution based on the practice of the trade.
The warnings offered months in advance of Volpocalypse proved prescient even if painful to the masses. We strongly encourage readers and subscribers to allow themselves the opportunity to read the articles noted from Seth Golden and Vance Harwood as they express strong considerations for participating in the short-VOL trading strategy as well as offer expertise on the subject matter. With that, let’s move on to Alphabet, the company of course.
Firstly, despite the after hours share price decline, Alphabet’s results handily beat analysts’ estimates on the top and bottom line. But that’s not always what drives share price in a favorable direction, at least initially. Here’s how the company did compared with Wall Street estimates:
- Earnings:$12.77 per share vs. $10.82 according to Refinitiv consensus estimates
- Revenue:$39.28 billion vs. $38.93 billion according to Refinitiv consensus estimates
- Traffic acquisition costs:$7.44 billion vs. $7.62 billion according to StreetAccount

Cost per click on Google properties dropped 29% from last year and 9% from last quarter, which might be alarming investors concerned that Google’s pricing power for ads is eroding.
Alphabet reported capital expenditures just north of $7 billion for the period, posting a much more expensive quarter than the $5.63 billion in capex that was projected.
The company reported an operating margin of 21% for the fourth quarter, lower than the 22% margin that was expected and the 23% margin it reported this time last year. Advertising revenue grew 20 percent from last year’s fourth quarter, to $32.6 billion, the same rate of growth as last quarter. Traffic acquisition costs rang in at $7.44 billion, up 13% from $6.58 billion during the third quarter of this year and up 15% from $6.45 billion during the year-ago quarter. TAC as a percent of advertising revenue came in at 23%, matching analyst estimates and falling right in line with previous quarters.
If one desires to pick nits over operating margins trending lower and forecasted to continue trending lower alongside rising CAPEX spending, go ahead. Earnings and revenues for Alphabet are still projected to grow strongly for 2019 and the company has a history of under promising and over delivering.
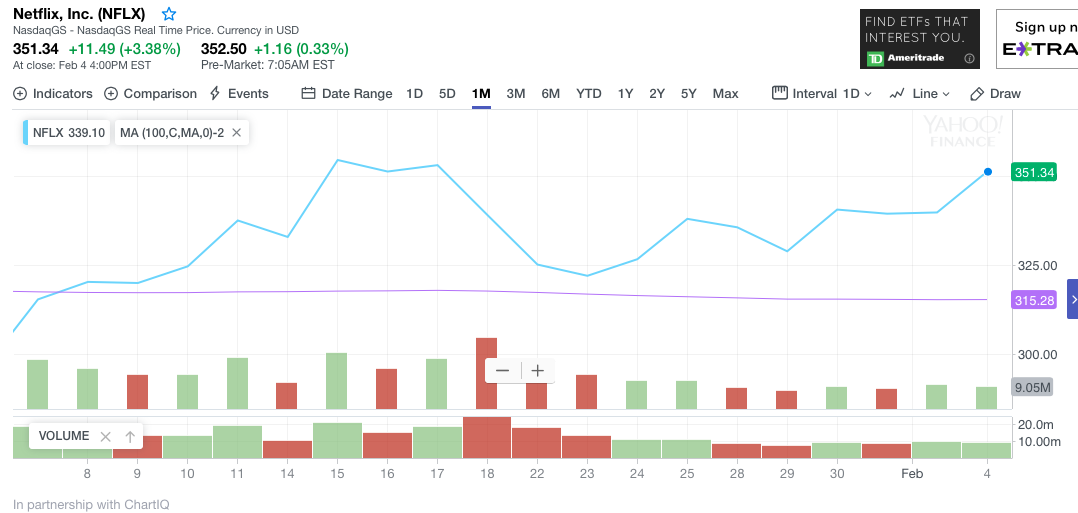
“But that’s a chart of Netflix (NFLX) above, not Alphabet!” Yes and just like Netflix produced a strong quarter and beat most analysts’ estimates for individual metrics, the share price dropped after earnings and is nearly back to where it was priced going into the earnings reporting season. If the market is relatively flat over the next 90-day period, Finom Group is of the opinion that shares of GOOGL will rebound from their post earnings release lows.
Ahead of tonight’s State of the Union address there was a widely publicized dinner date between Fed Chairman Jerome Powell and President Donald Trump. The reason we mention this is obvious given the scrutiny that Powell has endured at the hands of President Trump. But it’s not just the President laying it on thick, most market participants and economists have railed against the Chairman over the last several months and as the Chairman has pivoted from an October hawkish, autopilot stance to one that is dovish and patiently data dependent. All Fed Chairman undergo a certain amount of critique and criticisms, especially when they tighten fiscal policy and/or pivot from one action to the next. But here’s the main takeaway, all Fed Chairman pivot, change policy and react to the data and markets, all of them. This sentiment is shared in a recent CNBC.com article.
“A complex business cycle process is underway, whose outcome is yet to be determined. For the Federal Reserve it is a time… to gauge whether policy is still appropriately positioned to foster sustained economic expansion…It is clear, especially in the last month or two, that inflationary pressures are easing.”
The chairman was Alan Greenspan and the year was 1995, shortly after the Fed had halted a yearlong tightening campaign that investors feared might have gone too far.
But it could also have been Janet Yellen, who as chair said this in early 2016 not long after a controversial December 2015 rate hike left markets unsettled:
“I consider it appropriate for the committee to proceed cautiously in adjusting policy…The decline in some indicators has heightened the risk that” growth could falter. “If so, the return to 2 percent inflation could take longer than expected and might require a more accommodative stance of monetary policy.”
As Seth Golden and Wayne Nelson discussed in a recent State of the Market video, the Fed always reacts to the market and data. It’s investors that inject their personal ideology as to rationalize the Fed’s actions and change in tone or actions.
Over more than three decades and four Fed chiefs, there have been half-dozen sharp market downturns driven by a growth scare. These occurred outside of a U.S. recession. In each case, the market retrenchments relieved valuation pressures, punctured investor confidence, led to moderate growth and tame bond yields — and forced central bankers to pause tightening programs or even to ease policy.
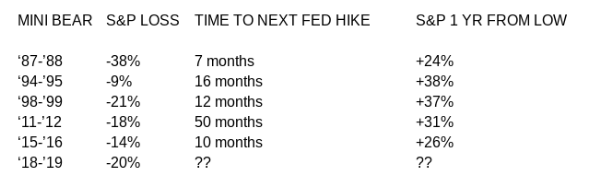
Tony Dwyer, strategist at Canaccord Genuity, has been characterizing the late-2018 collapse as the fourth “non-recession market crash” of the past four decades, using 1987, 1998 and 2011 as the relevant precedents. Dwyer argues that the 20% decline in the S&P 500 from last year “more than discounts the slowing domestic and global economy, as long as the Fed stops making policy and communication mistakes, the Trump administration resolves the trade conflict with China, and the yield curve remains positive.” Dwyer also suggests some sort of retest in the S&P 500 as well.
The Fed is likely to remain patient until the data suggests a rate hike is warranted, which many don’t feel is likely until, at best, June 2019. In between now and then, the equity markets will ebb and flow as earnings and geopolitical events unfold. Earnings and revenue estimates are adjusting to the flow of reports being delivered as the earnings season progresses. Here are two charts updates as of last Friday, February 1, 2019 (FactSet Data). They identify the changing estimates in earnings and revenues week –to-week.
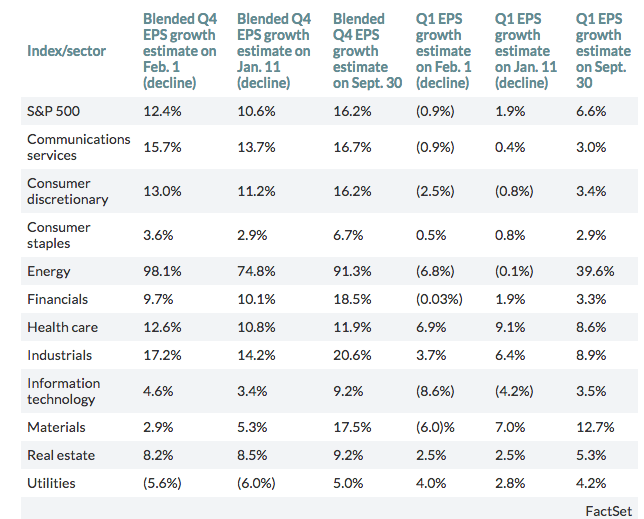
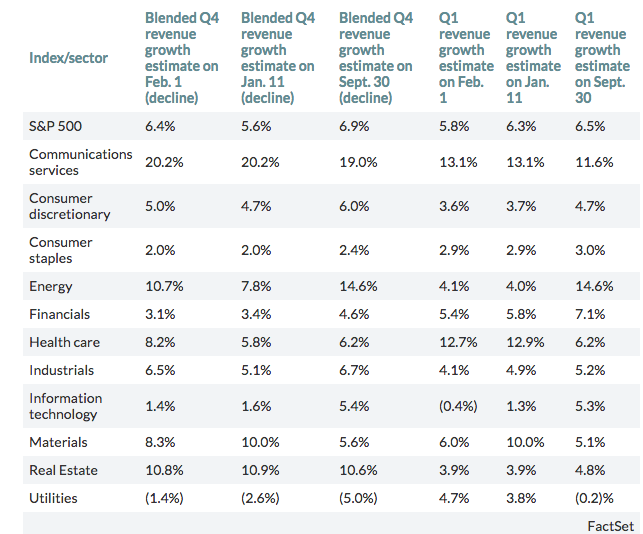
What is identified is that while revenues are expected to grow in Q1 2019, earnings are forecasted to decline slightly, according to FactSet Data. In contrast, Reuters is forecasting modest earnings growth in Q1 and progressively improving earnings growth throughout 2019. As noted before, these estimates will continue to be revised throughout earnings season.
It’s all about the Alphabet folks: Earnings, Federal Open Market Committee and Global Trade. Let’s see how things shake out!


