Tuesday, once again, found U.S. equities under pressure with the Dow Jones Industrial Average (DJIA) falling over 500 points in the first hour of trading. But through the remainder of the trading day, the Dow, S&P 500 (SPX) and Nasdaq (NDX) all rallied. The Nasdaq and S&P 500 both went positive at one point, but all 3 indices finished lower on the day by roughly a half percent. Coming into Wednesday, the futures remain under pressure even with Asian markets stabilizing over night and European markets expressing a mixed performance. Wednesday is shaping up to be another volatile day on Wall Street with both bears and bulls claiming to be victorious in their endeavors. One such bear, J.C. Parets of the All Star Charts blog, is suggesting that the recent market declines and volatility are pointing to a greater market crash to come.
“There is unlimited downside risk in the market right now and I don’t think it’s being respected,” he wrote. “It’s not until afterwards that they ask, ‘what happened?’” When the bottom falls out, that’s when the blaming begins.
“The Fed, the Trump, the Ebola, or whatever excuse du jour is being regurgitated on the various media outlets,” Parets wrote. “The only one to blame is ourselves.”
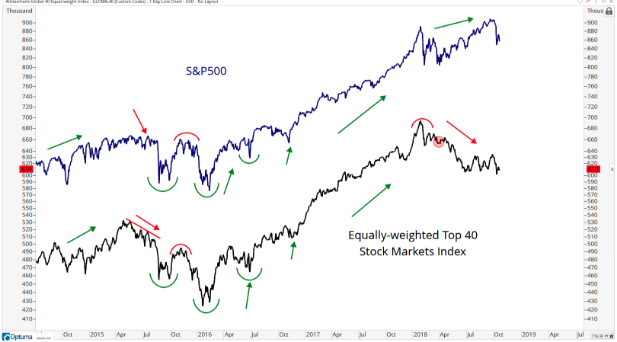
Parets is pointing to a few charts that are showing significant divergences, which usually signal a greater market downturn.
“When stocks fall, staples get a sympathy bid and outperform due to that very same lower beta and their defensive qualities,” Parets said. “With new highs in stocks, bulls want to see new lows in relative strength for staples. That’s a normal environment. It’s when they diverge that it is evidence of something changing.”
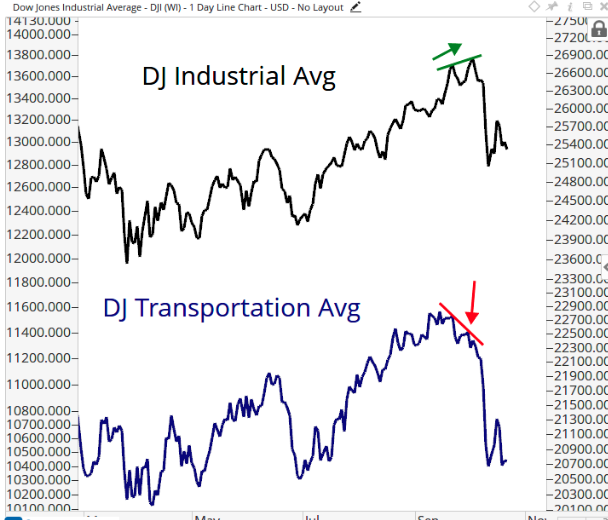
“We saw these divergences lead to collapses in 2000, 2007 and more recently a severe selloff in 2015,” Parets wrote. “You can see that with new highs in the Dow this month, transports put in a lower high, typical behavior at market tops.”
It’s hard to argue against what Parets is outlining in the positioned charts and even more so with the historic relevance of the divergences, but as we’ve seen over the last couple of years, history has not necessarily proven a guide for the market. In fact, the market has expressed many record setting statistics, stochastics and levels over the last couple of years, which tend to deliver such divergences as markets simply find momentum an impossibility to maintain. From record level RSI on the S&P 500 to numbers of days without a correction, the bull market cycle that began post the Great Financial Crisis has been one that confounds many investors and analysts alike. Nonetheless, the charts that Parets offers is worth its weight in “prudent study”.
As it was with the charts above, bulls and bears continue to diverge on the market outlook. CNBC’s Jim Cramer found something about Tuesday’s market activity that he now believes is promising for market bulls. Cramer stated that the VIX, also known as the stock market’s fear gauge, flashed a signal that could mean the market bottomed during
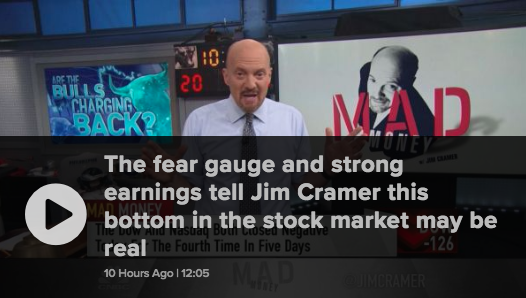
Mark Sebastian, who specializes in volatility, recently said that stocks could see another bout of pain even after recovering from a widespread sell-off two weeks ago. He also said that the VIX would likely peak before the selling was over. Two weeks ago it appears now that the VIX did peak around 28. Even as the major averages dropped roughly 2% on Tuesday, the VIX didn’t achieve the 28 level, peaking near 25 intraday and before falling back to 21. Sebastian and Cramer believe that based on the VIX not achieving a newer high level while stocks did find a newer low in this downturn cycle, a bottom is formed.
“The averages hit their lowest levels in five months today. About three-quarters of the stocks in the S&P 500 are currently in bear market territory,” he said. “American Express, Verizon, McDonald’s, United Technologies, Johnson & Johnson, J.P. Morgan, Goldman Sachs, Procter & Gamble and UnitedHealth all reported sharply better-than-expected earnings.”
Another “textbook sign” of a bottom came when the semiconductor stocks managed to rally in spite of a “brutal industry-wide downgrade,” the “Mad Money.”
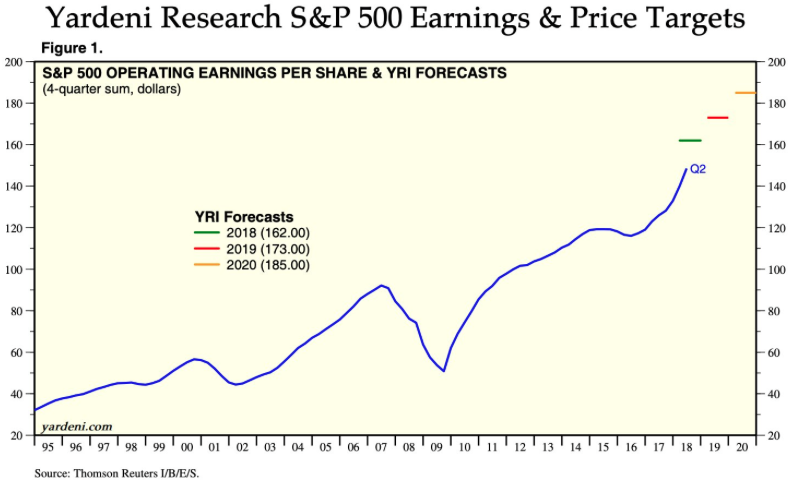
Tuesday’s market activity was viewed as promising in the eyes of Finom Group. It showed that the underlying economic drivers were being born out in corporate earnings and although technical damage has been done to the market, buyers were willing to step in as earnings continue to come in better than expected. It many not be well appreciated by the whole of the investor community, but nonetheless it remains a market truism: The stock market and economy/earnings don’t move in the same direction in the short run. But in the long run, these 2 factors move in the same direction. The following chart from famed economist Ed Yardeni identifies this very truism.
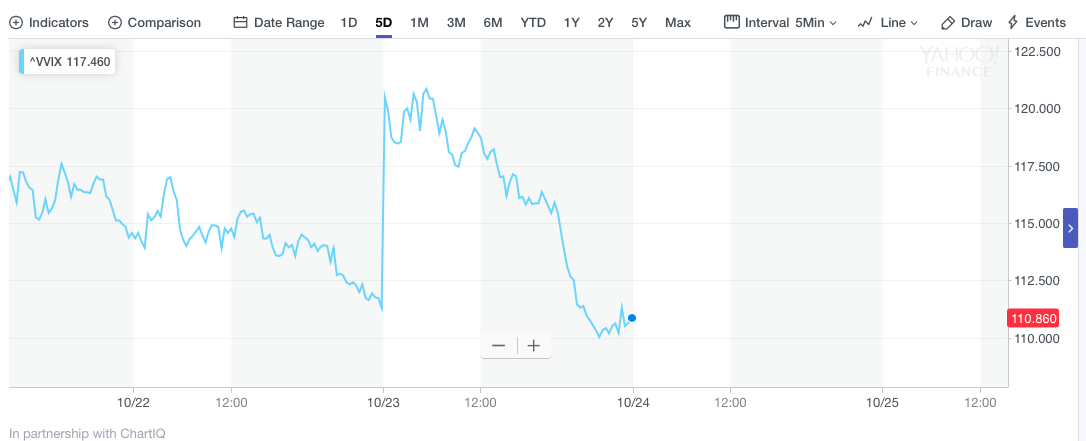
So are we oversold and have we hit a market bottom; time will tell. Certainly, however, there are many factors that are currently signaling a bottom is forming. While the VIX didn’t achieve a newer high in the latest bout of market selling pressure, VVIX (Volatility of Volatility Index) also signaled a near term market bottom. VIX call buying forces the upward trajectory of VVIX that is a shorter duration read on volatility in the market. It can prove a read on the inevitable move in the VIX itself as it tends to exhaust itself before the VIX peaks and turns lower. That is exactly what happened on Tuesday with VVIX climbing to 120 and then crashing through the remainder of the trading day. (See chart below)
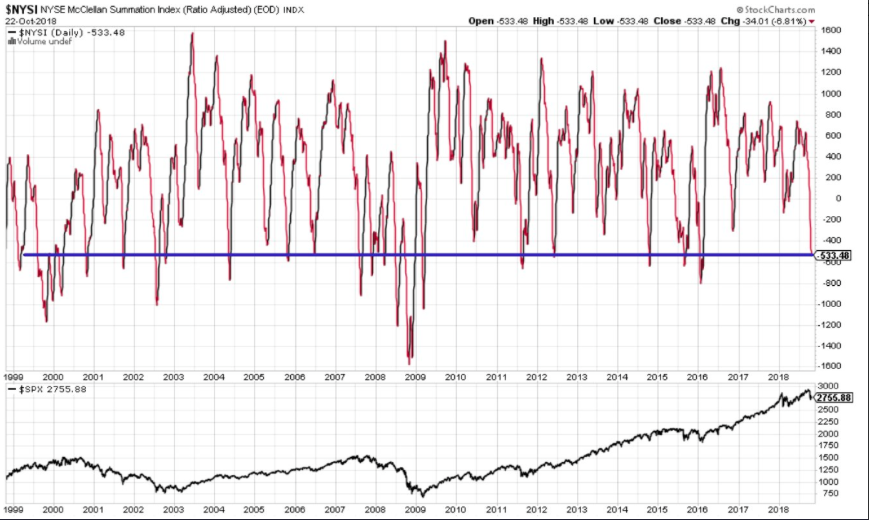
Along with VVIX crashing and the VIX following suit on Tuesday (VIX still finished higher on the day), another key indicator is signaling a bottom is or has formed. As Cramer mentioned in his S&P characterization, having some three quarters of the index found in bear market territory, the McCllelan Summation Index is signaling the S&P 500 is in oversold territory. (See chart below)
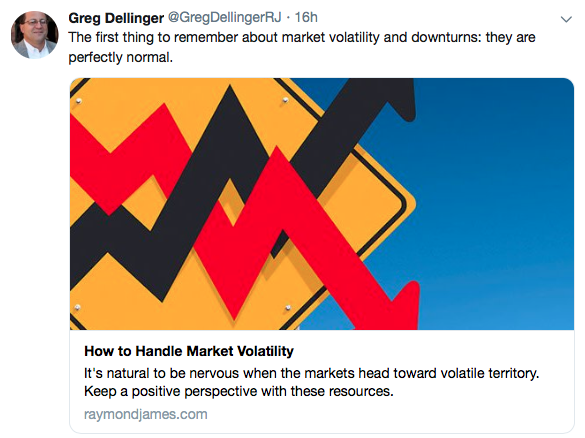
It’s not easy for investors and traders to participate in a declining equity market environment. In fact, it can be down right nerve wracking. Finom Group encourages investors/traders to keep their eyes and ears on the relevant economic data and S&P 500 earnings picture. Day-to-day market movement is less relevant and can lack fundamental correlation, but long-term the market always follows corporate earnings. Here’s what Gregg Dillinger of Raymond James recently offered in the way of investor sentiment, on Twitter, given the recent market turmoil.
It’s midweek and as the earnings picture becomes clearer for the Q3 2018 period, analysts and economists continue to factor in a rising rate environment. As such, we would be found lacking if we didn’t also inject some of the latest FOMC headlines.
On Tuesday, Raphael Bostic, the Atlanta Fed President offered the following in a speech before business leaders in Louisiana. The U.S. central bank should take its “policy foot off the gas” but doesn’t need to think yet about pumping the brake, said Atlanta Fed President. Bostic said he would support continued gradual interest rate hikes until the Fed got to a neutral policy rate. “While there is some uncertainty surrounding estimates of neutral…my assessment is that we are still a few rate hikes away,” he said. When the Fed gets to neutral, Bostic said he would “look to see if consumers and businesses continue to act in ways that did not suggest a buildup of excesses.”
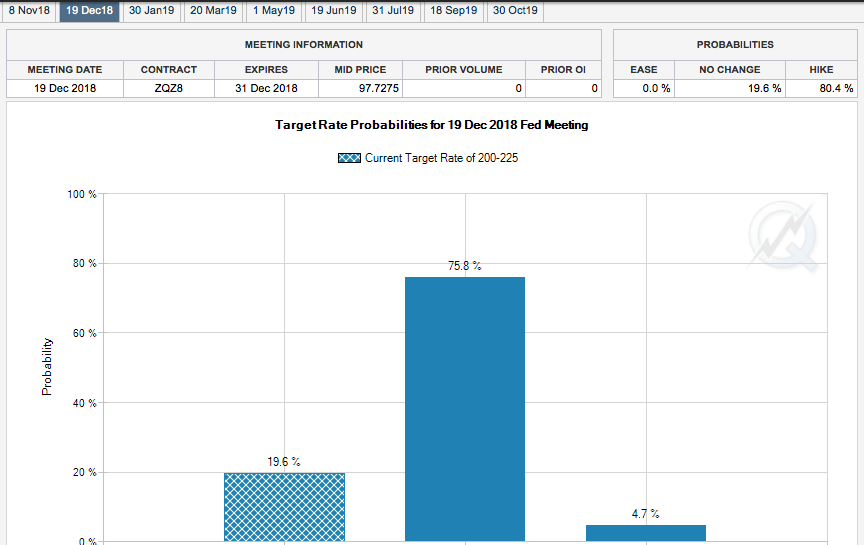
It is still widely expected that the FOMC will raise the Fed Funds rate by another .25 basis points come December. Many economists and analysts have formulated the opinion that the latest bout of market volatility is solely due to the FOMC’s steadfastness with regards to its outlook on rates. Oddly enough, current market rhetoric is highlighting the belief that the Fed will indeed hike rates in December, but then hit the pause button, so to speak. When we review the CME’s FedWatch Tool, we also see that the probability of a December rate hike has come down a bit from 80% to roughly 75% chance of a December hike.
Regardless of where the market takes us on Wednesday, it may simply outline sentiment for a big Thursday. On Thursday, a slew of big tech earnings are set to hit the tape with Twitter (TWTR) taking the lead before the opening bell.

After the close on Thursday, earnings from Amazon (AMZN), Intel (INTC), Snap (SNAP) and Alphabet (GOOGL) are all set to be delivered. And with earnings in mind for Thursday, investors will also be looking forward to Friday’s release of Q3 2018 GDP. The current median estimate for Q3 2018 GDP is presently 3.4%, according to economists polled by MarketWatch.
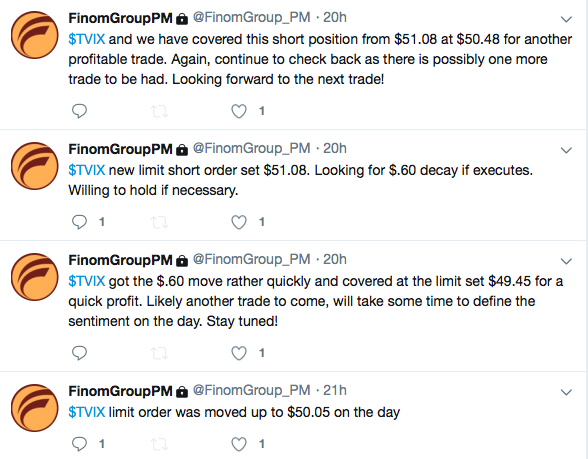
Regardless of what the trading day brings, Finom Group continues to deliver market volatility trading alerts to subscribers. Tuesday’s wild market moves proved another strong trading day with many alerts delivered through the day, as shown in the screenshot below.