
The breakout investors have all been waiting for has occurred with a new record high on the S&P 500 (SPX) and Nasdaq (NDX). The S&P 500 new high now resides at 3,044 or roughly 16 points about the former high. With Monday’s .56% move in the benchmark index and new closing high of 3,039, the weekly expected move of $29/points has a good chance of being captured ahead of Wednesdays key economic data points, triple-shot of earnings releases (AAPL, SBUX, FB) and the FOMC rate announcement.
With the new record high in the S&P 500, Morgan Stanley’s chief U.S. equity strategist Mike Wilson’s most recent chart and notes seem to be offsides with what the market has produced.
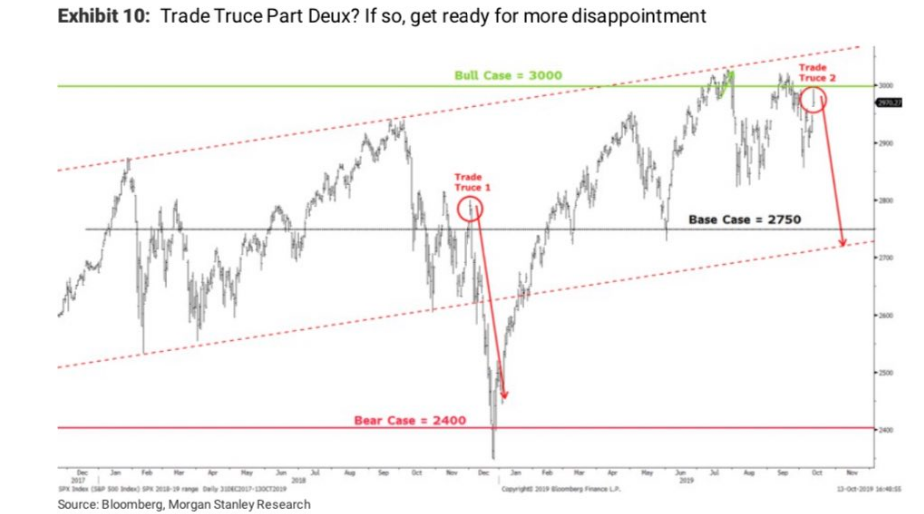
The chart identifies the bull case as being SPX 3,000 while the base case identifies the 2,750 level and the bear case would be achieved at 2,400. Clearly, Wilson underestimated the bull case and throughout 2019 he has overestimated the bear case.
“while we didn’t expect the S&P 500 to be making new highs, .. we have to acknowledge the fact that it is .. [W]e can’t help but think the upper end of our long standing range will hold,” amid an “earnings recession that still seems to be getting worse.” (Wilson)
For Mike Wilson, it’s only a matter of time for the reality to sink in with investors, he says. His model on earnings revisions suggested the S&P 500 would have been flat in the past 12 months, as opposed to an actual 6% increase.
“This reflects the very aggressive shift in monetary policy recently by the Fed and other central banks — i.e. that policy change is priced,” Wilson wrote in a note. “However, once the market gets past the initial relief it will have to contend with the deteriorating fundamentals.”
Here is what Finom Group outlined in it’s weekly Research Report to subscribers when discussing Wilson’s outlook and analysis on markets and trade.
“In a recent CNBC interview, Wilson suggested the economy needed a recession to forcibly cleanse the market from its’ unsustainable valuation. While we don’t agree with Wilson’s outlook, we can understand the fear of faltering earnings growth that is still assumed out in 2020 by investors and analysts alike. Finom Group is of the opinion that Wilson is overlooking the inventory overhang story, a byproduct of the trade war that has maligned the domestic and global economy throughout 2019. We also believe there is the potential that with improved trade relations, the headwind of the strong U.S. Dollar and weak crude oil prices will alleviate and bring about tailwinds for corporate profits in 2020. Of course, we emphasize, WITH IMPROVED TRADE RELATIONS!“
Wilson has likely found himself in a conundrum he hadn’t anticipated, especially after rather sound analysis and “calls” on the market in 2018. It’s like the saying goes though, “Being a permabear isn’t about being an objective analyst/strategist, it’s simply awaiting the inevitable and maintaining a consistently negative tone.” So with all that being said concerning Wilson’s year-long bearish outlook, does this mean a bear market or correction can’t take place; certainly not. All it simply means is that it won’t likely take place for the reasons Wilson has varied throughout the year.
The new record highs on the S&P 500 seem to be producing notes from various analysts and financial institutions. The latest offering from Citigroup asks a simple question and answers it at the same time. I guess we can call these notes, but they come across as rather “confused” to say the least:
CITI asking: “With the SPX at the highs, technical charts infer an ascending triangle formation and imminent bullish breakout. Given light positioning and the potential for bearish sentiment to snap back, could the “risk” be more of a melt up (FOMO driven)?”
- CITI answers:
- “We think there is a lot of good news in the price”
- “To repeat 2019 again, the bar is high and one can’t simply assume another year of potency from the same market drivers”
- “Thoughts welcome”
- Bears are lacking conviction and seem confused. That is a back-drop for a coming sell-off….
And then, of course, there is the latest from J.P. Morgan’s equity strategists that suggest rather strong EPS growth may be afoot IF and only IF…
“S&P 500 companies could see >25% cumulative EPS growth over two years if tariffs are unwound. This catalyst would likely release pent-up demand from businesses and consumers. Based on investor/style positioning (low equity exposure, crowding in defensive sectors, and rich valuation for low-vol equities), the market does not appear to be pricing this outcome. Even if existing tariffs remain in place and no new tariffs are announced, we would expect fundamentals to improve starting in 4Q.”
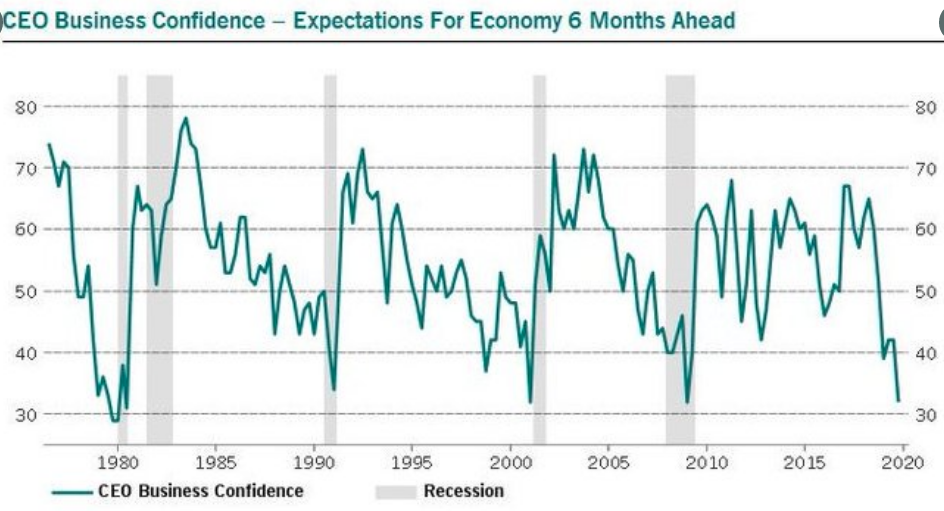
Bulls and bears seem confused and have good enough reason to feel this way. Earnings are lackluster to say the least for 2019, recession signals seem to be here one day and gone the next. CEO confidence is as low, if not lower, than it was during the Great Financial Crisis of 2008.
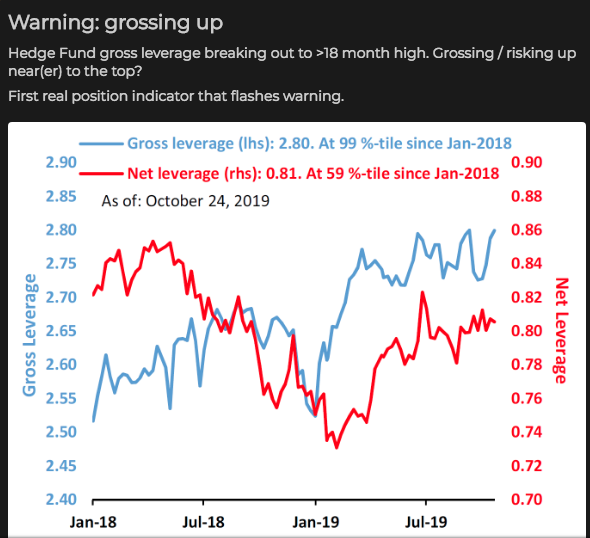
I guess you could say that it all comes down to the outlook; after all, isn’t that what investing is all about. By definition, investing is about the future, not the present and if the outlook is favorable, the forward pricing mechanism that is the equity markets should be moving higher, no? Maybe that is why gross leverage amongst institutional investors has just broken out to an 18-month high?
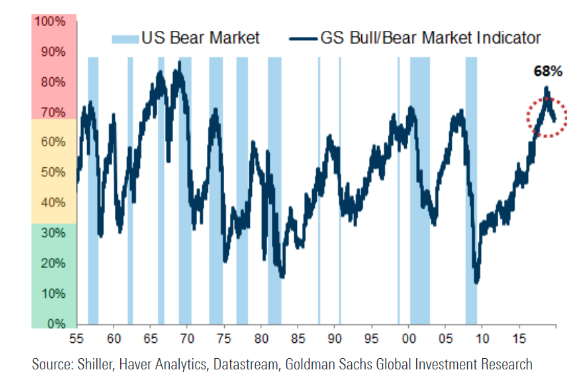
And maybe it is only recently that the Goldman Sachs Bull/Bear Market Indicator has turned lower, as we come into the final stretch of the year, because of the outlook for corporate earnings in 2020. The Bull/Bear Market Indicator comprises the average percentile (in US) for ISM, slope of yield curve, core inflation, unemployment and Shiller PE. For Unemployment and yield curve, a lower reading corresponds to a higher (riskier) percentile.
Given all the aforementioned, inclusive of analysts’/strategists’ notes, Finom Group holds firm to the belief that the bull market will live on into 2020, absent any exogenous shocks to the economy. Having said that, we also recognize the weakening economic metrics and anticipate the sequential slowdown from Q2-Q3 to be temporary and consistent with our outlook on global trade headwinds alleviating. The following notes are from Finom Group’s weekly Research Report as well (Sunday October 27, 2019)
“Based on the seasonal patterns, it does appear as though the October period has already lived up to its “billing” month-to-date. As such, the end of the month does suggest a down-leg into the month of November, which is typically followed by another breadth thrust and the S&P 500 surging higher into year’s end. With this in mind we invite traders and investors alike to ask themselves…
- Do I have cash on the sidelines to take advantage of a dip near-term
- Have I prepared a shopping list of stocks/ETFs to buy on the dip
- Does the macro-outlook support “buy-the-dip”
- If the answer to all 3 aforementioned questions is yes; you are in sync with the outlook and preparation fostered by Finom Group and Seth Golden’s Golden Capital Portfolio.
Most measures of market breadth suggest that the S&P 500 will achieve a new all-time high near-term.“
While we did predict the S&P 500 would achieve a new high near-term, we didn’t predict it would take place right out of the gate this week. But maybe we should have when we review what typically happens on October 28th historically. From a statistical standpoint, Oct. 28 has produced the best gain for the S&P 500 over the past seven decades, said Ryan Detrick, senior market strategist at LPL Financial, in a Sunday tweet (see chart attached).
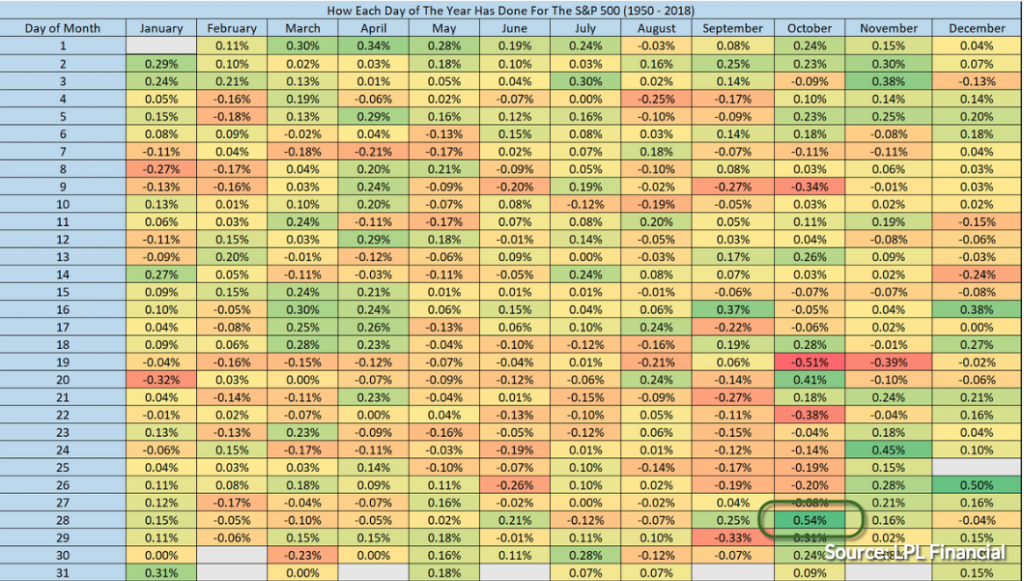
“There are days that are up more often, but in terms of avg return, on Oct 28 the SPX is up 0.54% on avg,” Detrick told MarketWatch via email, noting that that is the highest average return during any day of the year.“
Well, history wins again folks… and repeated! Additionally, although investors have leveraged high of late, there still seems to be a good deal of market-related disbelief out there. Maybe it is because this time last year, the market was expressing a corrective phase that ultimately turned out to produce a technical bear market and painful holiday season for investors. But that was last year and this year might produce something very different. It has already throughout October and as we complete the last 3 trading days of the month.
According to an analysis by Ned Davis Research, markets will not only do better than last year, but may even rally through the holidays. Some of the differences between 2018 and 2019’s Q4 period have been iterated and outlined by Finom Group in recent reports as follows:
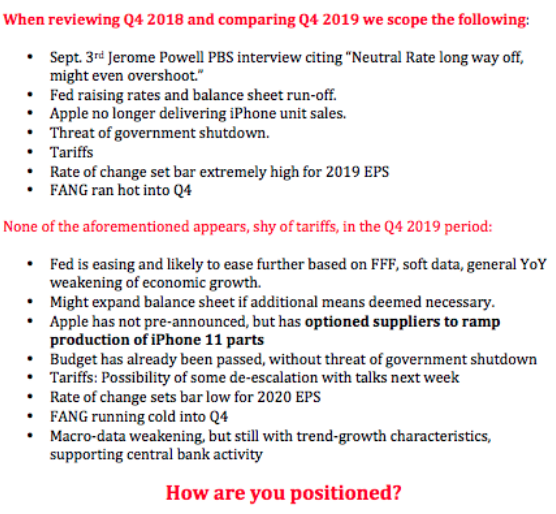
Ned Davis Research analysts Will Geisdorf and Wenbo Zhou also recognize the differences with the two Q4 periods in question, namely the different central bank policy stance.
“What a difference a year makes!” Geisdorf and Zhou wrote. “Now 85% of the world’s central banks are cutting rates.”
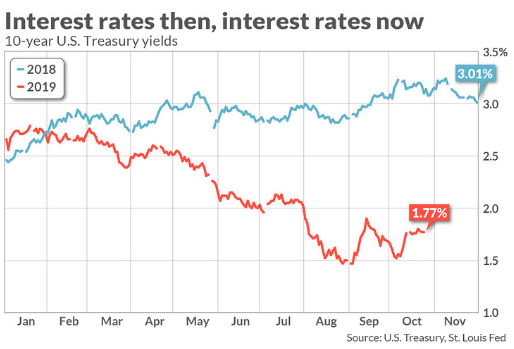
Ned Davis Research shows that yields were on the rise in 2018, but have fallen through most of this year. At the start of last December, the 10-year Treasury note yielded about 2.85%, a full point above today’s levels. With this in mind, the Ned Davis analysts believe the bond rally may be over, “at least temporarily,” they said. Yields and bond prices move in opposite directions.
Technical factors were pretty awful in markets last year at this time as well. For one thing, Geisdorf and Zhou wrote, global breadth was deteriorating. “By this time last year, most countries had declining long-term trends.” In contrast, 69% of countries are now in up-trends, which Ned Davis defines as rising 200-day moving averages. This is also something Finom Group displayed to subscribers in this past weekend’s Research Report with the following 1-year S&P 500 chart.
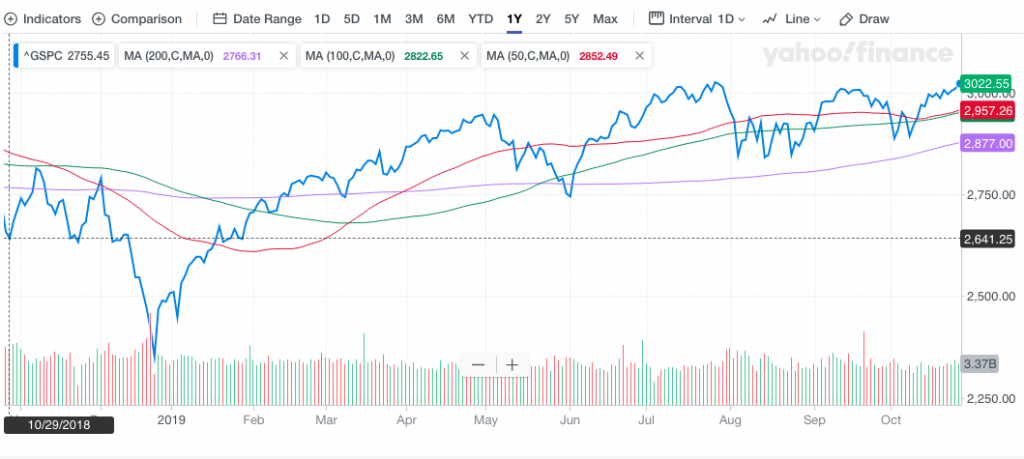
When we look at the right-hand part of the chart, we can see the moving averages are all curling upward. That’s what we desire to see most and what points to a dramatic difference from October of 2018 (very left side of chart). The chart shows the same time period from last October 26th. In it we can see the 50-DMA completely rolling down and the S&P 500 itself trading below all 3 moving averages. This is the look, we are always desiring to avoid and have throughout October and with the S&P 500 trading above all 3 major moving averages.
So with a new S&P 500 record being set, what’s next? Nobody knows for sure what is next and for this reason we would suggest thinking more long-term and with 2020 in mind, not necessarily with just Q4 2019 front of mind. There’s still headwinds for which they will challenge the market through year-end, least of which may prove a seasonal factor that usually finds a dip taking place in early November.
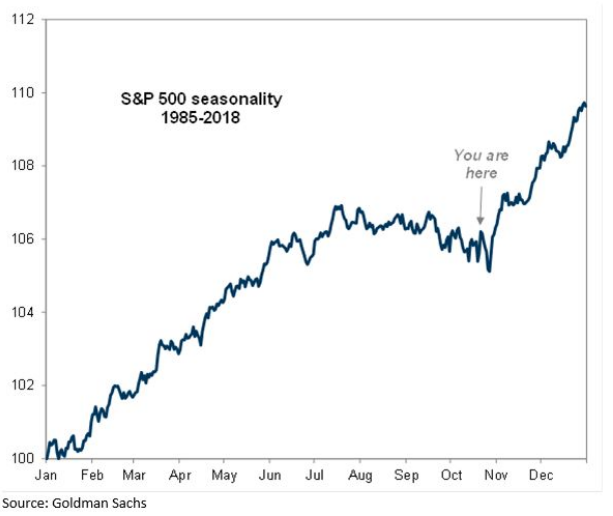
As shown in the chart above, the seasonal dip that usual occurs in early November tends to be reversed come Black Friday and found with a rally through year-end. The seasonal chart foreshadowing gains ahead certainly has a greater probability of coming to fruition with some of the macro-headwinds achieving greater, positive certainty. The U.S./China trade war has seemingly peaked and on the verge of moving toward a more positive state of affairs, possibly reaching a phase 1 trade deal near-term.
In addition to the phase 1 trade deal, the U.S. will consider extending certain tariff exclusions on $34 billion of imports from China as the two nations work toward a trade agreement, the Office of the U.S. Trade Representative said Monday. Nearly 1,000 products were exempted from the July 2018 tariff, and those exclusions are set to expire on Dec. 28.
The extension would give the companies importing those products leeway, while mitigating tensions between the global superpowers as they hash out the details of their agreement. In September, China said it plans to exclude American farm goods, including soybeans, from tariffs amid the trade talks.
Improving trade relations will be of great benefit to the domestic and global economy. Couple this outcome with the recently agreed upon Brexit delay until January 2020 and global central banks easing and the macro backdrop is far different than it was this time a year ago. The more favorable macro backdrop may be stimulative enough to show itself in business sentiment and spending, leading to greater GDP growth and earnings into 2020, for which J.P. Morgan’s quant team believes cyclical stocks will come back into favor.
“It’s time to embrace the nascent rally in the riskier part of the stock market, according to JPMorgan Chase & Co.’s strategist Marko Kolanovic, who says the economy is about to pick up and threats to the rally are overstated.
For professional investors who have cut net equity exposure to extreme lows while boosting defensive holdings like low-volatility shares to record highs, it’s time to consider buying cyclical sectors such as energy, Kolanovic said.“
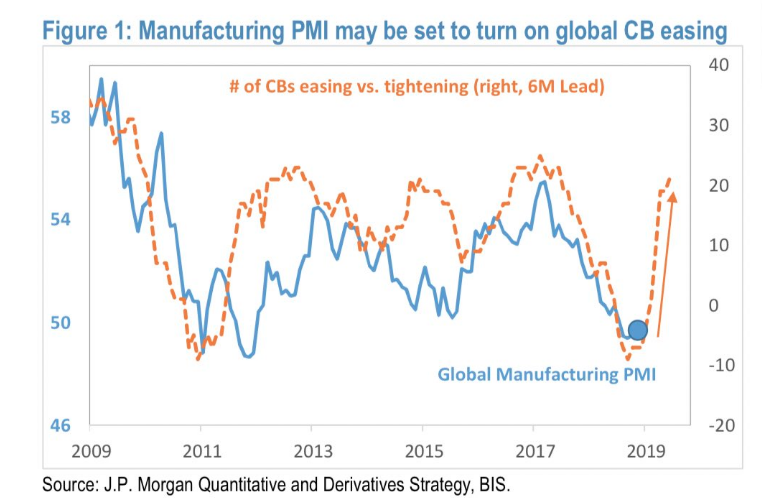
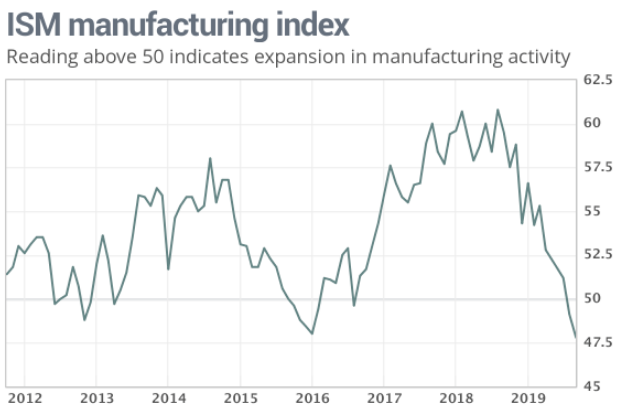
The chart from J.P. Morgan’s quant team depicted above identifies a potential turn around in global PMIs that should spur cyclical stocks. Speaking of manufacturing, we can’t forget that this week is another crucial week for investors as it is jam packed with market moving economic data, namely Nonfarm payrolls and ISM Manufacturing Index data. It remains to be seen if the ISM Manufacturing Index can rebound after the September report. The Institute for Supply Management said its manufacturing index fell to 47.8% last month from 49.1%, marking the lowest level since June 2009. That’s when the Great Recession ended.
The ISM report won’t be delivered until Thursday and after what is anticipated to be the most anticipated day of the trading week, Wednesday. Wednesday will bring with it the private sector, ADP payroll report and the first look at Q3 GDP. Economists polled by MarketWatch forecast GDP to come in at 1.5%, a slowdown from the previous two quarters. And if the data wasn’t enough to warrant caution by investors, the FOMC will also be announcing a 25 bps rate cut on Wednesday, to be followed by the usual Fed chair press conference.
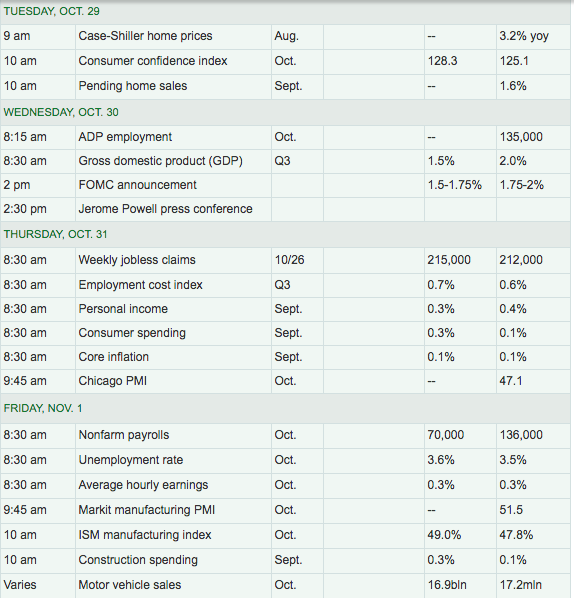
This rate cut may prove the last rate cut for the mid-cycle rate adjustment offered by the FOMC. If it is, it would prove the equivalent amount of cuts issued in 1995 and 1998, 3 rate cuts. According to Fed watcher Tim Duy and Goldman Sachs, the Fed will need to start signaling more explicitly to the financial markets what economic conditions will bring what the central bank calls a “mid-cycle correction” to monetary policy to an end.
Estimates of economic growth for the third quarter hover on the low side of 2%. While this places growth close to the Fed’s estimates of the long-term sustainable pace of activity, it does not want to see growth slow further and threaten to put upward pressure on unemployment. Policy makers have gained a new appreciation of the benefits from sustained, low unemployment and fear losing those benefits. Moreover, persistently low inflation, and signs of falling inflation expectations, only enhances the case for easing monetary policy.
Still, the incoming data is not terrible. The housing market has regained momentum in recent months, consumer sentiment remains high, core manufacturing orders continue to hold roughly steady and initial jobless claims remain at very low levels.
All that said, the Fed will not continue cutting rates indefinitely. Absent a deterioration in the data flow, central bank officials will eventually become confident that they have turned policy sufficiently accommodative to overcome existing risks to the forecast. At that point, they will want to pause while they assess their handiwork.
The point at which they want to pause could come after this week’s cut. Policy rates will be sitting in the range of the lowest forecasts in the Fed’s September Summary of Economic Projections. That seems like a reasonable point for the Fed to signal, for example, that future rate cuts will depend explicitly on a renewed worsening of the economic data.
Here are some comments from Goldman Sachs chief economist Jan Hatzius:
“We expect the FOMC to deliver a third and final 25bp rate cut at the upcoming meeting. … We believe the mixed growth data since the last meeting more closely resembles the Committee’s baseline forecast than the downside scenarios under discussion. … We expect a somewhat hawkish rewording, with “act as appropriate to sustain the expansion” replaced by a reference to recent easing and the less committal “will act as needed to promote its objectives.”
Everyone will be looking for hints of a fourth rate cut – or if the Fed thinks this is the end of the “mid-cycle” rate cuts.”
The day before the FOMC rate cut decision and highly relevant guidance for future monetary policy will be one that is less important to investors and with equity futures pointing to a market that aims to digest Monday’s gains. With the S&P 500 at record levels, however, investors are now contemplating the achievement and what’s next for markets. Some are suggesting that their are 3 variables that may prove the undoing of the recent rally to new record levels.
If you’re wondering what these 3 variables are that could tip the market back over, well the answer is rather simple. The same things that brought the market to record highs!
- Easing monetary policy
- Easing trade tensions
- Better than forecasted earnings
If any of these 3 variables falter, the market can easily find itself in retreat once again and find Mike Wilson’s base case scenario of SPX 2,750 easily achieved. Let’s face it, an aged and illiquid bull market is easy to find any significant headline reverse the October gains rather quickly.
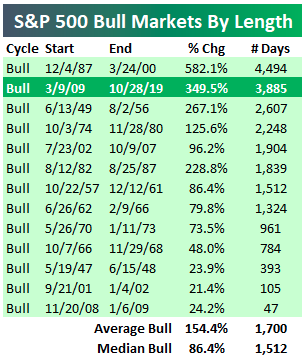
The table above from Bespoke Investment Group outlines the duration and gains of the current bull market compared to previous bull markets. This bull market easily ranks as the second longest and second strongest on record. We’re now more than 1,000 days longer than the 1949-1956 and 1974-1980 bulls, and we’re nearly 2,000 days longer than the 2002-2007 bull. We’re also more than double the average bull market in terms of both duration and gain. The average bull sees a gain of 154.4% over 1,700 days.This bull we’ve seen a price gain of 349.5% over 3,885 days. The bull is unarguably tired, lacking volume and liquidity, so don’t be surprised if a misstep in Fed messaging/guidance or a poor economic data point deliver a sharp rebuking of investors at some point. Nonetheless, J.P. Morgan like Finom Group believe any near-term market dips would prove fleeting and as the bull market is forecasted to live on. And why do we believe the bull market will live on, even if a near-term dip should take place? Market dips should be anticipated AND BOUGHT, assuming we are not in a recession or heading into a recession near-term. But let’s say that is the worst case scenario and we are in a recession. History suggests investors would be surprised at the returns for the S&P 500 during recessions.
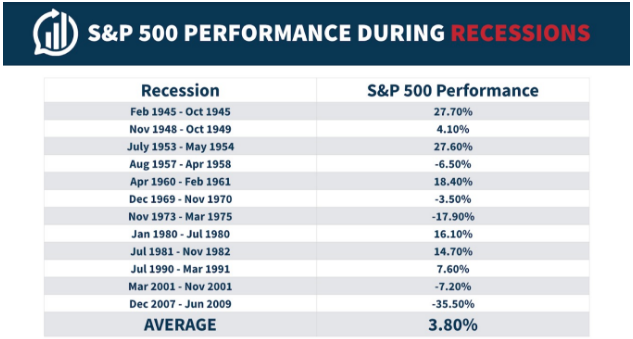
The S&P has delivered a 3.8% on average return during recessions going back to 1945, according to National Bureau of Economic Research data cited by Ritholtz Wealth Management’s Ben Carlson. As Brett Favre would say, “Relax.” It’s only recency bias related from the 2007-2008 recession and bear market that expands our fear of what to expect from markets during recessions. Was there a recession in 1987, no! And yet the market still had one of the most fantastic bear markets in a single day. Perspective folks, perspective! With this in mind let’s continue with some degree of positivity and with regards to the near-term outlook…
J.P. Morgan strategists said stocks could reach next year’s target of 3,200 for the S&P 500 sooner than expected. “Looking ahead, given improving trade rhetoric, the market could reach our 2020 midyear price target of 3,200 sooner (by late 2019 or early 2020),” Dubravko Lakos-Bujas, the firm’s chief U.S. equity strategist, said in a note to clients on Monday.
While the notes from J.P. Morgan’s analysts are quite optimistic, not everyone shares such optimism, especially given the Fed’s tough task ahead.
“From our point of view, you’re likely to get a sell-off based on a Fed disappointment,” said Julian Emanuel, chief equity and derivatives strategist at BTIG. Fed funds futures are signaling a 50% chance for a rate cut by March, but many economists, like those at Goldman Sachs, expect this Fed cut to be the final one and it could signal it’s finished.
I expect the Fed to cut a quarter point, but then back off promising any more cuts, though it may keep the door open just slightly. We think the market has discounted a lot of positive news, and it’s likely to be shocked by this now.
A sell-off could take the S&P back down to the 2,875 level. There’s the potential for the market to pull into the 200-day moving average in the next couple of weeks, if the market is sufficiently spooked by the Fed,” he said. The 200-day moving average was at 2,877 Monday.“
It’s going to be another long week for investors and traders and one filled with anticipation and varied forecasts. As such, think beyond the week and plan accordingly.


