
Although the S&P 500 (SPX) has fallen sharply, by more than 1%, on two consecutive Mondays, there is a silver lining to glean from all the selling pressure. U.S. equities have remained under persistent pressure and as bond yields have tumbled lower. On Monday, the S&P 500 fell by 1.22% only to be topped by the Dow Jones Industrial Average (DJIA), which fell by 1.48% on the day.
While the S&P 500’s consecutive Monday declines of -1%+ have been a bit much for investor fortitude, historically it sets up the market for a rebound, according to Bespoke Investment Group. The next 4 days has averaged +3.24 returns in 2019. Let’s see how this statistic pans out in the trading days ahead and with futures pointing to another negative open on Wall Street.
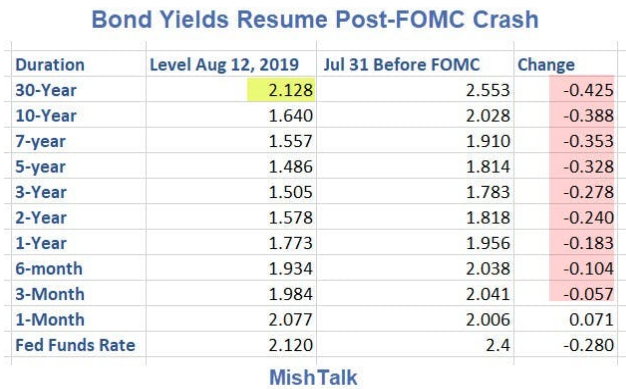
The main reason for equity futures dipping in the pre-market again on Tuesday is largely due to bond yields still moving lower and after another strong rally in Treasuries on Monday. The flight to bonds has been quite persistent in 2019, even with the Fed easing by 25 bps at the July 2019 FOMC meeting. What typically happens when the Fed eases, is that the front end or short-dated maturities fall faster than the long-end of the bond yield curve. That simply hasn’t happened this time around. This time is different, as they say.
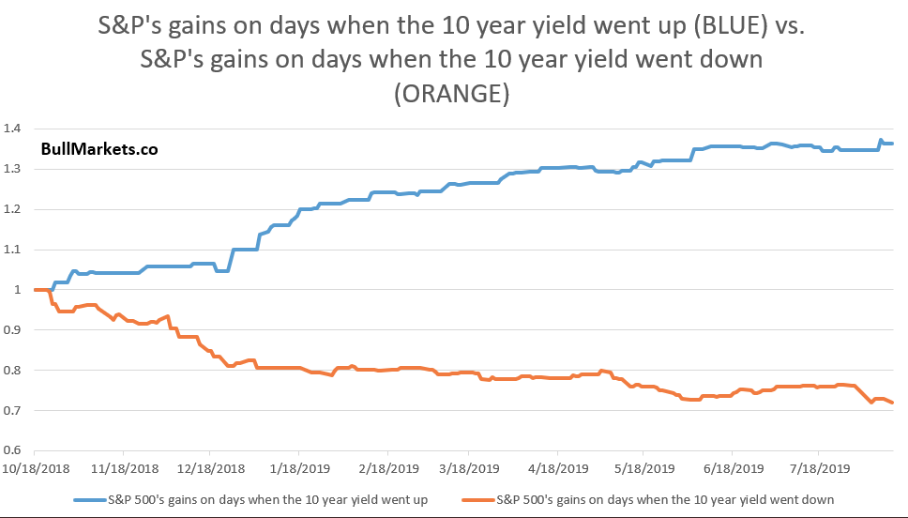
In Finom Group’s weekly Research Report, we denoted the very tight correlation between what the bond market is doing and how it feeds directly and adversely into the equity market. When bond yields have fallen, so has the equity market and visa versa. (See below)
Moreover, during the past 200 days, all of the S&P 500’s gains have occurred on days when the 10-year Treasury yield went up, and all of the S&P 500’s losses have occurred on days when the 10-year yield went down.
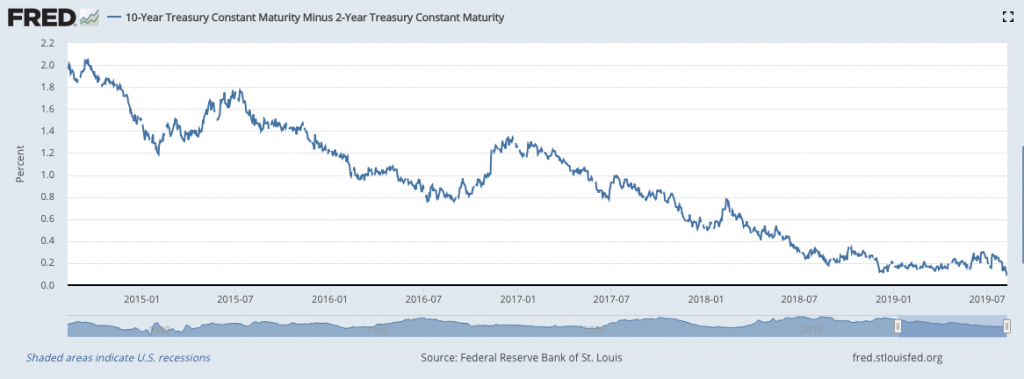
What is more followed, the 2-year and 10-year Treasury spread, appears poised to invert any day now, with the curve at its flattest level since 2007. On Tuesday, the spread between 2-year and 10-year Treasury yields narrowed to less than 6 basis points.
An inverted curve simply means a shorter-term interest rate is higher than the longer-term one that it is being compared too, and that inversion has been a reliable recession signal.
The traditionally watched two-year and 10-year Treasury spread appears poised to invert any day now, with the curve at its flattest level since 2007. On Tuesday, the spread between two-year and 10-year Treasury yields narrowed to less than 6 basis points.
An inverted curve simply means a shorter-term interest rate is higher than the longer-term one that it is being compared too, and that inversion has been a reliable recession signal.
On the data front Tuesday, the latest NFIB small business optimism survey for July will be released at 6:00 a.m. ET. An annualized and monthly Consumer Price Index (CPI) and core CPI data for July will be released before the opening bell as well. The big economic data deluge comes Thursday with monthly retail sales, Empire State and Philly Fed manufacturing indexes as well as the NAHB index.
Naturally, with the markets reeling from late last week and yields continuing to decline, Morgan Stanley’s team of analysts have been out with the bearish outlook once again.
Morgan Stanley’s Andrew Sheets:
- “…as yields have raced lower and markets have priced more and more central bank accommodation, the yield curve in the US and Europe is becoming flatter and flatter. That pricing, at least to us, is consistent with central banks taking increasingly aggressive action, but those moves failing to lift growth or inflation sustainably over the medium term. Needless to say, that isn’t a great story…We remain cautious, as we believe that a number of challenges remain. Among them, the risk that high policy expectations make disappointment more likely, and that even if those aggressive expectations are met, easing isn’t expected to improve growth or inflation materially.”
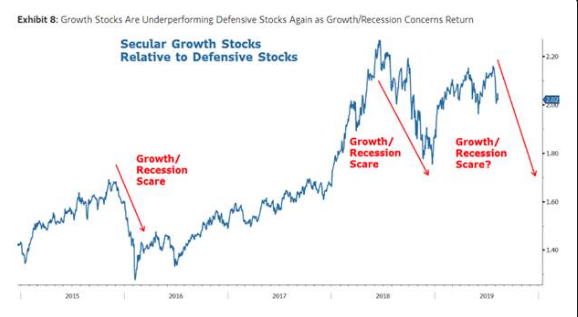
Mike Wilson:
- “Growth stocks look more vulnerable than defensives at this stage…the failed breakout last week for the S&P 500 confirms we are still mired in a cyclical bear market…Until economic and earnings data stop deteriorating and/or the yield curve re-steepens, we think it is too early to turn bullish…The bottom line is that the Fed has reversed its position over the past 9 months because the outlook for the economy, both here and abroad, deteriorated significantly. We continue to think that many investors are too complacent about the risks to the US economy from the ongoing corporate profits recession. While trade tensions are weighing on corporate confidence and the various Purchasing Manager Indices (PMIs), we think the deterioration in corporate profits and margins is the bigger driver.”
Amidst tumbling Treasury yields, Morgan Stanley indicates a rising risk of a recession for which the FOMC will need to cut rates further and at successive meetings in 2019. Morgan Stanley anticipates successive cuts at the September and October FOMC meetings and an even steeper path ahead, with four more rate moves in 2020 taking the funds rate close to zero.
“Taking a walk through Chair Powell’s checklist of factors the FOMC will be looking at when deliberating policy adjustments going forward, it seems to us there is already a clear need to cut rates further,” Ellen Zentner, a Morgan Stanley economist, said in a note, citing a reduction in hours worked for July, typically a precursor to layoffs.
A bigger move “cannot be ruled out, especially if policymakers see convincing enough evidence in the data that their baseline outlook for the economy has been disrupted, and a pronounced downturn has become more likely.”
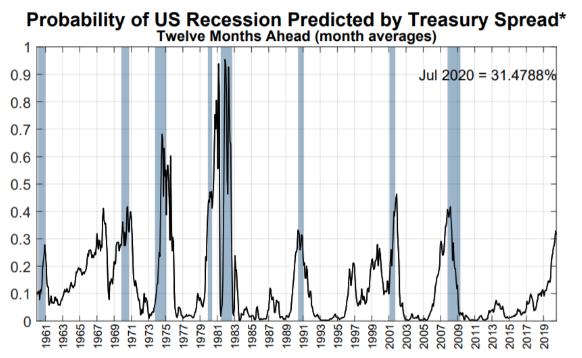
With all this talk about bond yields falling, an inevitable yield curve inversion (2s/10s) and the Fed being forced to cut rates further in the meetings ahead, naturally these dialogues coincide with increasing recession fears. Economists increasingly worry that the next recession is closing in on the U.S. economy. Bloomberg, for example, reports that economists now see a 35% chance of recession in the next twelve months. Additionally, the New York Fed’s recession model is also at it highest point since 2007.
Putting the details surrounding the yield curve and rising recession fears/risks together, well-known Fed watcher Tim Duy suggests a recession is not on the near or mid-term horizon. “I have long held a preference of the 10s2s spread as a recession indicator. Specifically, recessions tend to follow occurrences where the Fed continues to tighten policy even after the 10s/2s spread inverts.”
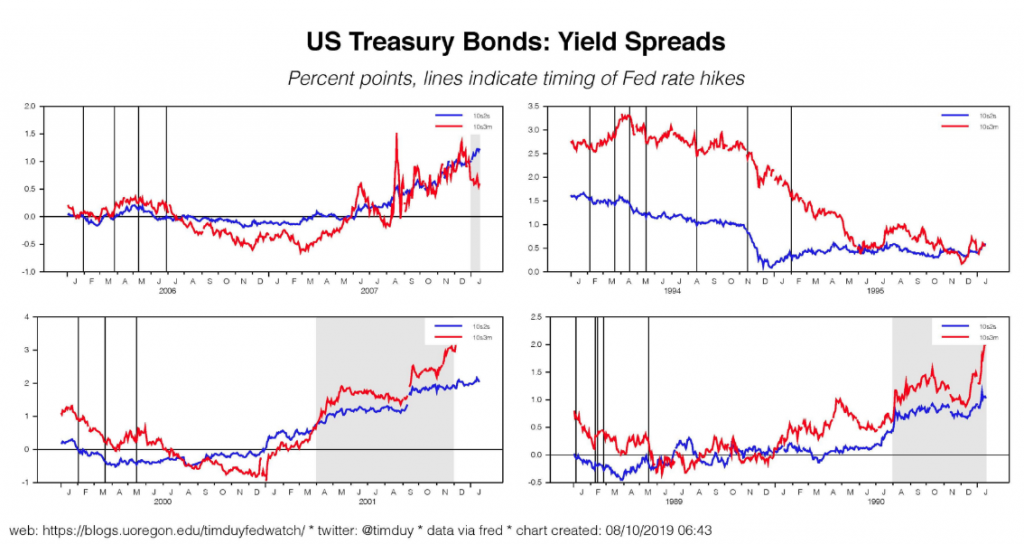
In only one of these four episodes depicted above did the economy manage to avoid recession at the end of a tightening cycle. In 1995, the Fed stopped raising rates before the 10s/2s spread inverted and soon turned to rate cuts. In the other episodes, rate cuts came too late.
The current episode is unusual in that the 10s2s spread never inverted before the Fed began cutting interest rates. In that way it is similar to the 1995 story. But it is unlike 1995 in that the expectations of Fed easing have driven the short end of the yield curve into a fairly substantial inversion.
“My interpretation is that market participants have correctly anticipated the Fed’s reaction function with the expectation of substantial easing in the months ahead hence creating the inversion on the short end. This easing will be sufficient to derail impending recessionary threats. If the Fed’s easing was expected to be insufficient, I would expect that the 10s2s spread would be inverted.
Consequently, at this point I still do not expect a recession in the near year. Under my baseline scenario, the Fed’s upcoming rates cuts will slightly steepen yield curve and the picture will look like 1995. If the Fed remains a little too tight – doesn’t cut fast enough or deep enough – the yield curve will be flat to flirting with inverted like in 1989. The latter case would risk leaving the economy too vulnerable to negative shocks and it would be all too easy to see a geopolitical conflict pushing the economy toward recession before the Fed could react.“
While Duy paints a lucid and logical picture of recession probabilities based on yield curve inputs, Goldman Sachs is decreasingly optimistic about the outlook for the U.S. economy. In notes delivered over the weekend to clients, the firm reduced its Q4 outlook for the economy under the weight of tariffs to be imposed on China.
- “Fears that the trade war will trigger a recession are growing. .. increased pessimism about the outlook from trade war news may lead firms to invest, hire, or produce less. .. we have taken down our Q4 growth forecast by 0.2pp to 1.8% (qoq ar).”
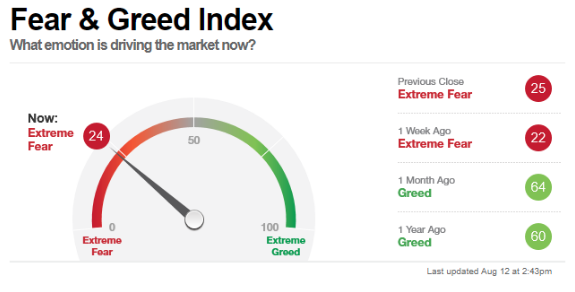
In no way shape or form is fear dying down on Wall Street amidst the negative market and geopolitical headlines. The escalation of fear is palpable and reaching extremes as indicated in the latest CNN Fear & Greed Index.
Alongside the CNN Fear & Greed Index pointing to extreme fear, the NYSE saw panic-like selling on Monday as gauged through the Arms Index. Selling in NYSE-listed stocks exhibited panic-like tendencies for the first time in over 3 months. The Arms, a volume-weighted market breadth indicator, usually rises when the stock market declines, the magnitude of selling in declining stocks tends to be greater than the magnitude of buying in stocks gaining ground. When that happens, the Arms Index tends to rise above 1.000; market technicians view a rise above 2.000 as suggesting panic-like activity. The NYSE Arms is at 2.287, on track to close above 2.000 for the first time since May 1, and was at the highest level since Dec. 4, 2018, while the Nasdaq Arms is at 0.993. The number of declining stocks outnumbered advancers by 2.13 to 1 on the NYSE and by 1.79 to 1 on the Nasdaq. The volume of declining stocks was above advancing stocks by 4.87 to 1 on the NYSE and by 1.78 to 1 on the Nasdaq.
While this is just another sign of fear amongst an already bearish market sentiment that has been rising of late, typically it signals bad things on the horizon…IF YOU SOLD INTO THIS PANIC…AND HERE IS WHY!
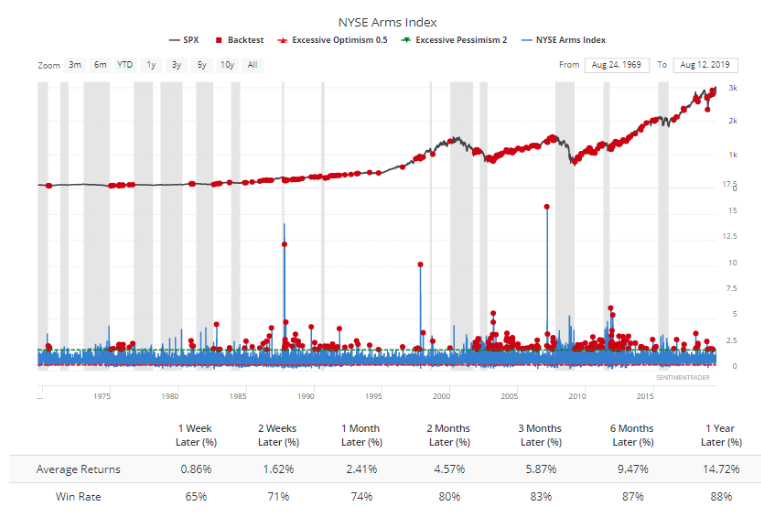
Panic selling in a bull market led to losses the vast majority of the time (for shorts). As we can see from the chart and table positioned below the chart, when the NYSE Arms Index spiked like it did yesterday, typically this represented a near-term bottom in stock declines across all time frames going out 12 months. The win rate is at least 65% a week later with an average return of .86 percent.
While bonds are in rally mode and equities are being cast aside, near-term events will underpin or disrupt the current trend in the two asset classes. Hong Kong protests have added another layer of uncertainty to the markets, which CNBC’s Jim Cramer believes the market is paying attention to, as it further weakens the Chinese economy.
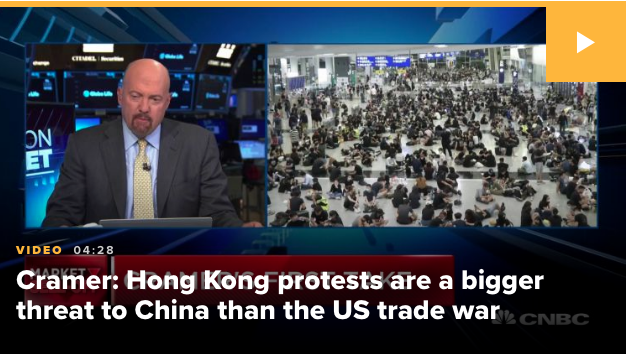
“I just don’t think the Chinese communists can avoid it anymore. The Chinese government is more worried about Hong Kong than they’re worried about trade. Because Hong Kong is something that’s very visible in Europe.
“This is more serious than the trade talks. If you want to know what could tip you into a worldwide recession, it is just a shutdown of Hong Kong, a major financial hub in Asia.”
Of course, China is already engaged in an elongated trade feud with the U.S. that has weakened its economy and doesn’t need, but is forced to contend with it’s own civilian unrest. Tuesday’s Hong Kong protest activity has made headlines again, as the airport shuts down for a 2nd consecutive day.

While Bei Jing tussles with its civilian unrest and protests in Hong Kong, nothing appears to be developing favorably on the trade front with its counterparts in the U.S. either. What isn’t being discussed much in the media, however, is an upcoming deadline that may prove to have consequences to the equity market as well. U.S. sanctions against Huawei Technologies Co. Ltd. looms large next Monday, August 19th, when the 90-day exemption from certain export restrictions will expire. Goldman Sach’s analyst David Kostin called August 19 “a key date for equity investors,” that could serve as a flashpoint for additional volatility.
“A further extension appears unlikely given the U.S. government announced that federal agencies are prohibited from doing business with Huawei. Huawei sales outside of China will face risk immediately after Aug 19. Retaliation by China appears possible should the Aug 19 deadline pass without another extension.”
Stephen Pavlick, policy analyst at Renaissance Macro Research, explained in a Monday note to clients that an easing of tensions concerning Huawei is unlikely as the company sits at the nexus of U.S. complaints over Chinese economic policy.
Google parent Alphabet Inc. (GOOGL) is the most high-profile American firm to be impacted by the ban—it has continued to provide services to Huawei related to the widely used Android smartphone operating since the sanctions were put in place in May, due to a 90-day reprieve granted by the White House Administration.
Google could be significantly affected by the expiration of the reprieve, given that Huawei smartphones have a 20% market share in the Europe, where Google generates 32% of its revenues. If restrictions are not rolled off this could drive a handset share shift or some disruption for Google’s and other apps,” especially if Huawei’s recently unveiled smartphone operating system launches, according to Bank of America’s research analyst Justin Post.
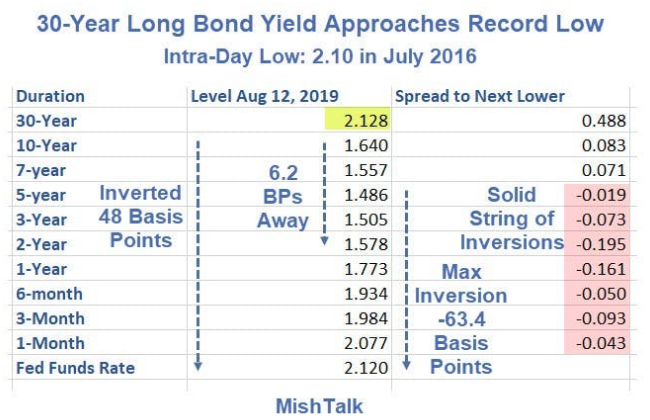
Reverting to our commentary and coverage of the bond yields debacle since late 2018 and to-date, on Tuesday we just witnessed a record low level in the 30-year bond yield, below 2.10 percent.
We’ve already seen the benefits of lower yields for the 30-year fixed rate mortgage through mortgage activity in 2019, which has recorded a surge in refinance activity. Such refinance activity aids in shoring-up the both the household and corporate balance sheets. Both are already in good shape, but with the potential for tariffs that are aimed at U.S. consumers, what’s a little more cash in the pocket to cushion the blow of potential rising prices from tariffs.
In addition to the new all-time low yield on the 30-year Treasury, it’s been clear that the oversold conditions in yields has been present for a goodly amount of time now. The 10-year yield’s weekly RSI has been below 30 for 8 of the past 11 weeks in fact.
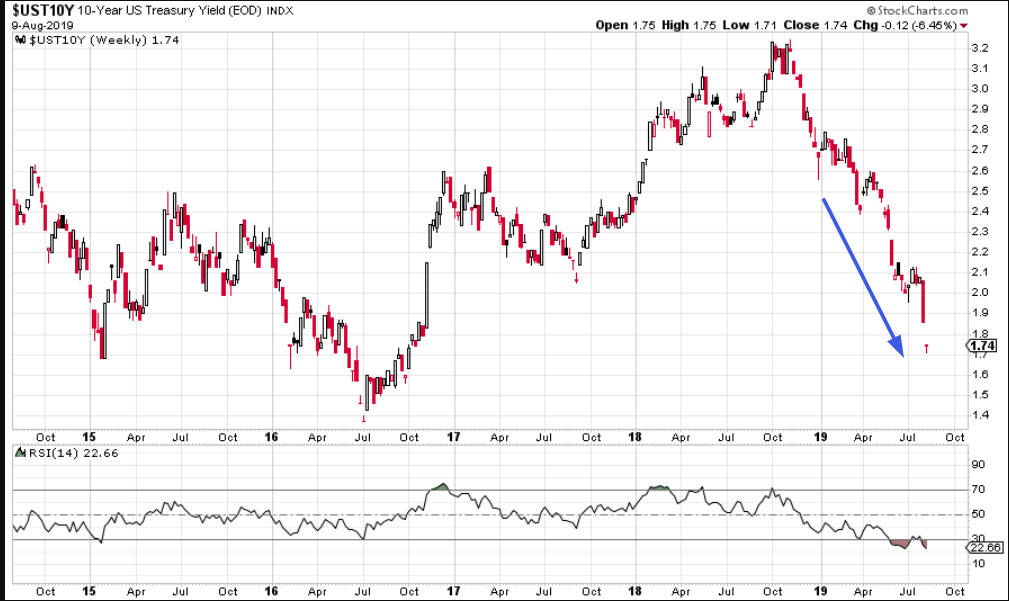
Remember, issues can remain overbought or oversold for long than one might think. They can also become even more oversold and overbought. With this in mind, let’s take a look at what history has suggested we can look forward to in this regards.
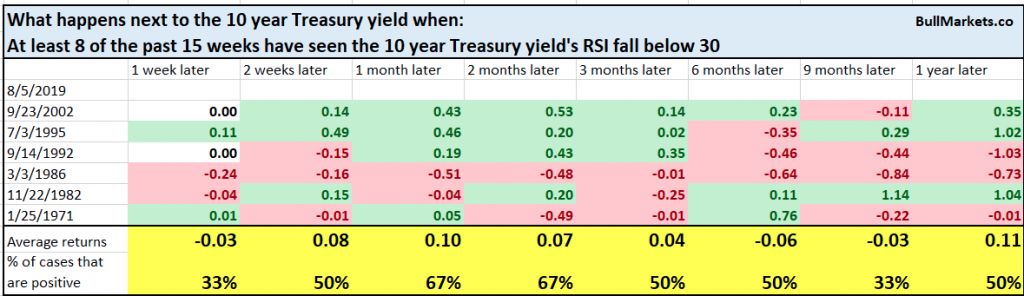
The sample size study from Bullmarkets is rather small and only found with 4 other like occasions since 1986, but it would appear that a bottoming process in yields is afoot. There may be some other good news afoot for equities near-term as well and as we look at what fear or volatility (VIX) is telling us.
The VIX spiked up to and above 24.50 last week. This was a significant spike that began 5 days early and from a base of roughly 12. Monday’s VIX spike was also large, but it failed to achieve the previous spike level, indicating lower highs. This is usually how corrections work take form. The S&P 500 makes a lower low and the VIX makes a lower high. When these “double VIX spikes with lower highs” occurred before, the VIX usually fell 1 month later, according to Troy Bombardia’s study below:
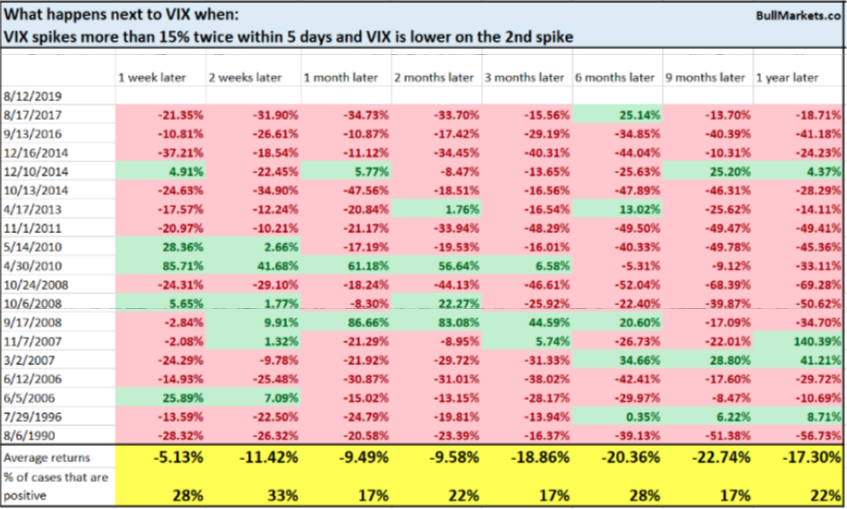
A key extrapolation of the study, juxtaposed with the VIX presently resting just above 21 on Tuesday morning, suggests there is still upside room potential for the VIX and it could still be lower than the previous spike. At the same time, it’s usually proven that with the VIX above 20 and VVIX above 110, hedging with VIX options becomes expensive and less favorable near-term. Such studies should not be an indication of what will come, but what could transpire according to history.
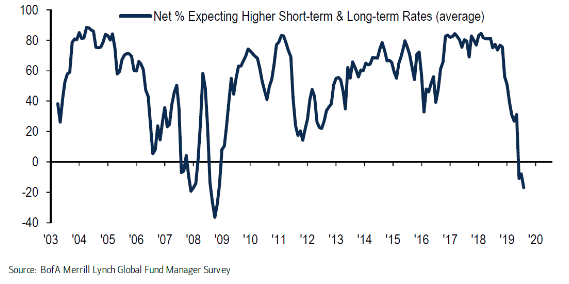
It’s clear that fear is on the rise and yields remain in the spotlight. According to Bank of America’s Fund Manager Survey, a net 43% of investors expect lower short-term rates & only 9% expect higher long-term rates over the next 12-months, taken together this is the most bullish FMS view on bonds since Nov’08.
Recall from 2018, as yields were rising and with the 10-year yielding greater than 3.20%, most investors and economists believed the 10-year would achieve 4% over the next 12 months. See what happens when everyone is leaning on one side of the boat!


