
I haven’t written an article like this one in the past, so bear with me here folks. This is the type of article that many would characterize as a “public service announcement” or PSA for short. My main consideration for this article are resources. One of the most important concepts about investing that I’ve discovered over the last 22 years is the need for an individual investor to develop their resources. This idea of resourcing or resourcing can take on many shapes and forms nowadays and with the hundreds of different financial services available to the average investor.
As a professional money manager, if that is what one choose to become/do, I can’t stress enough that one’s success is highly dependent upon the resources they are surrounded by. The “lone wolf” investor is a rarity, as they tend to perform poorly and eventually “trade” their account out of the “game”. The ego, which is the key element driving the lone wolf investor, is essential to poor performance and the outcome is rather constant. This is not the path successful traders/investors travel.
So with this as a baseline understanding for what separates success from failure as an investor, naturally there are good resources and “not so good” resources for which to absorb in the financial services industry. In suggesting that this article is a PSA, we’ll focus on the “not so good“. Let’s face it, resources are only as good as their utility or means for which they help one to achieve their investing goals over time. There’s no singular resource that will ultimately drive your performance, therefore developing resourcES should be part of the goal-driven investor’s process. Many, reliable sources of information that lend themselves to a repeatable, profitable performance should be the consideration of every trader/investor. Building resources is an ongoing, never-ending process that demands review periodically and for the sake of effective resourcing.
So let’s start with some of the biggest and free resources for the average investor. In keeping with the notion of free resources, do consider the colloquialism “you get what you pay for” in that whole equation. If it’s free, in my opinion it should come with a “beware” label! CNBC network is a free resource, and I’ve often found the television network and social media links to the network a dual-edged sword for the everyday Joe/Joan investor.
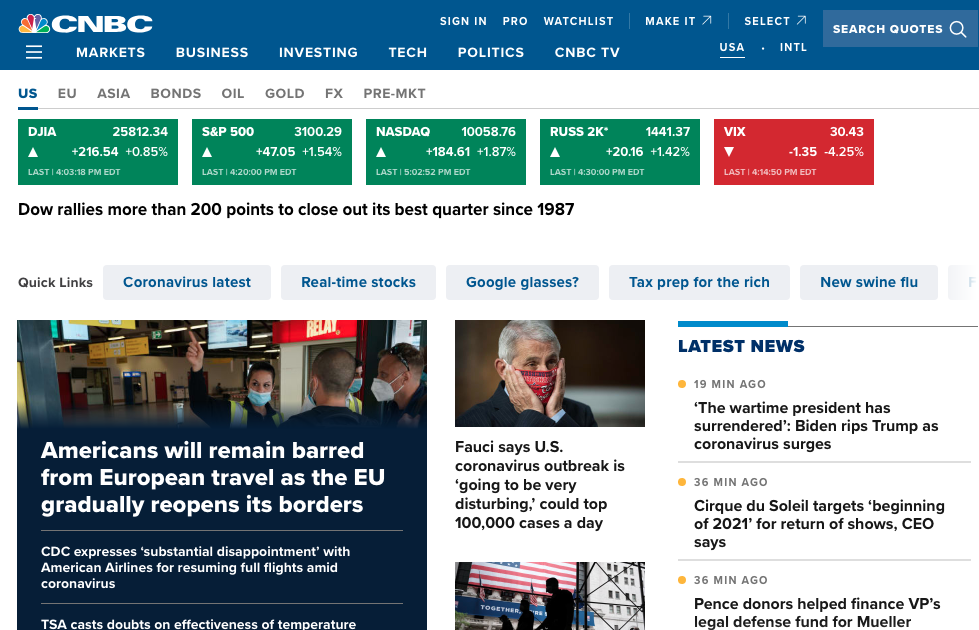
This is not to suggest that CNBC doesn’t have or even add value for the average investor. Rather, the average investor needs to understand that CNBC’s first objective is to support its business model through the production of financial news programming that would drive advertising revenues. CNBC sells advertising time on their network and correlated website/s. CNBC is aware that fear is the number one driver of foot traffic to its website and key attraction to its live, daily television programs. The average investor will tune-in and surf toward information that they feel will prevent them from losing capital. The aspect of losing capital is actually the main focus of most investors, given the inherent emotional aspect of the objective, which carries more weight than growing their capital. Unfortunately, growing capital does take a back seat to the focus of eliminating losses amongst the novice and intermediate investor community. Because this is a resource that the average investor believes will aid in reducing loss potential, the pervasive, negative feedback loop of loss aversion often results in limitations on capital invested. The average investor has limited capital in the market. This is actually true of professional investors as well; I hate to say!
I wouldn’t propose that CNBC is going out of their way to only deliver fear-driven content to investors. There’s a decent mix of programming as the average investor likely has a fear threshold for which they can sustain the absorption of such fear and loathing-centric content. I was a big fan of the series The Walking Dead. I watched it from season 1-8 until I just had enough. It got to a point where the fear and seeming hopelessness for the story had reached a limit for me. CNBC knows the average threshold for which an investor/trader will tune-out and as such mixes the content to deliver some degree of hopeful narratives and content. But here’s the key for investors to always consider when it comes to optimizing their CNBC or CNBC-like resources: The market goes up over time and therefore the optimal action for an investor is to simply add exposure to the market over time (Index ETF specific). With this in mind, understand that most of your resources are opinion-driven, even when offered by those professional fund managers and industry analysts that appear as guests on CNBC.
The determination of a good resource from a bad resource is dependent on reviewing the utility or effectiveness of that resource. I’m of the opinion that CNBC offers itself as a decent resource, but it demands scrutiny and an understanding of the imperfections inherent to the platform/media content. Remember, much of what is being offered through CNBC is opinion-driven; the opinions of analysts, strategists and/or fund managers
Example #1
While I could demonstrate various examples of proven faulty analytics and opinions offered through CNBC over the years, here are just a few that might prove relevant today.
- Facebook (FB) is in the headlines frequently, but even more so lately due to the number of brands deciding to temporarily discontinue advertising on the platform.
- Facebook has been found with a great deal of criticisms over the years.
- The Cambridge Analytica scandal was the first major detraction for Facebook investors since its IPO
- The stock stumbled due to this scandal as analysts proposed the scandal would dissuade users of the platform and ultimately force the company to adjust its business model, which would adversely hinder the stock’s performance.
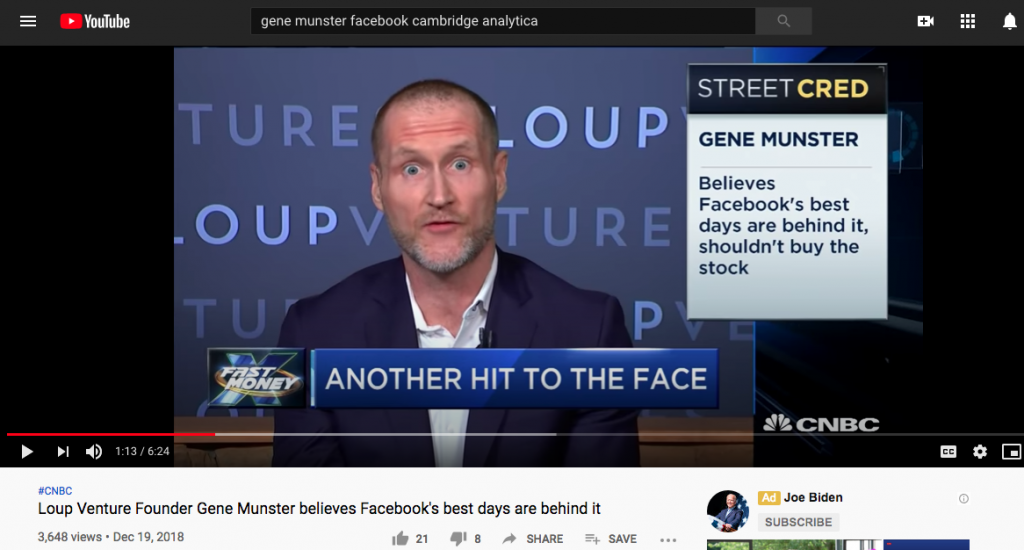
Gene Munster, depicted in the YouTube video recording of a CNBC interview concerning Facebook and the Cambridge Analytica scandal impact on its business is dated back to December 2018. The caption is pretty clear from the sell-side analyst who believed the best days for Facebook were behind it. Since that time, Facebook has delivered double-digit earnings and revenue growth in continuum. The share price had nearly doubled and reached an all-time high trading price of $245 in June 2020, from roughly $130 in December of 2018. Gene Munster of Loop Ventures was clearly wrong with his opining of the future of Facebook and as it relates to investors. Does this mean that CNBC is a bad resource; NO! This exercise is to simply recognize that the resource is littered by and with opinions, primarily.
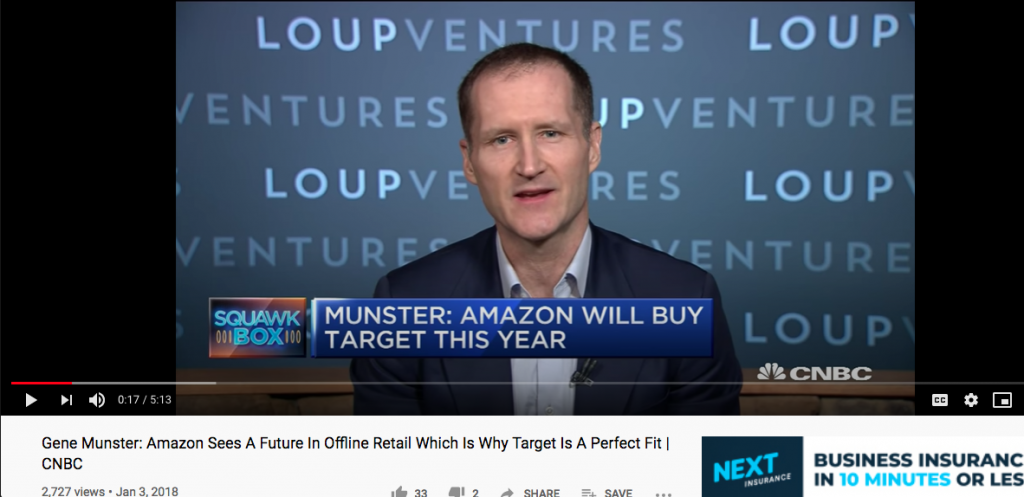
As shown here, unfortunately this was another misgiving by Gene Munster in 2018. He forecasted that Amazon (AMZN) would buy Target (TGT) in 2018. Fast-forward two years later and of course this prediction has not come to fruition either.
There are a great many guests that appear daily on CNBC and some are assigned a more constant segment of programming. Cornerstone Macro’s chief market technician Carter Braxton Worth is a frequent participant on CNBC’s Fast Money and Options Action show in the evenings. His forecasts and or technical analysis has been so consistently poor over the years that the investor community has nicknamed him “Carter Worthless”. I’ve chronicled Carter’s misgivings over the years, warned investors of such misgivings, but for some reasons the CMT finds himself in high demand by CNBC.
Example #2
In earnest, the following offering from Carter via his Twitter account does appear logical and the chart pattern does appear ominous for the market. Carter offers his “thinking” within the tweet as follows:
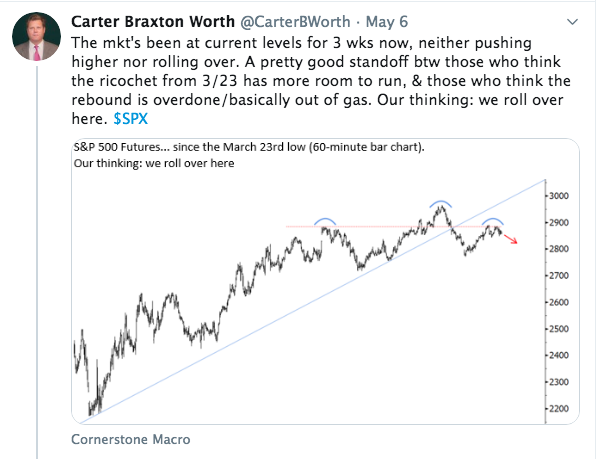
Unfortunately for Carter, by June 8th the market did not roll over and actually found a new relief rally high, consistent with much of the historical market statistics we had studied.
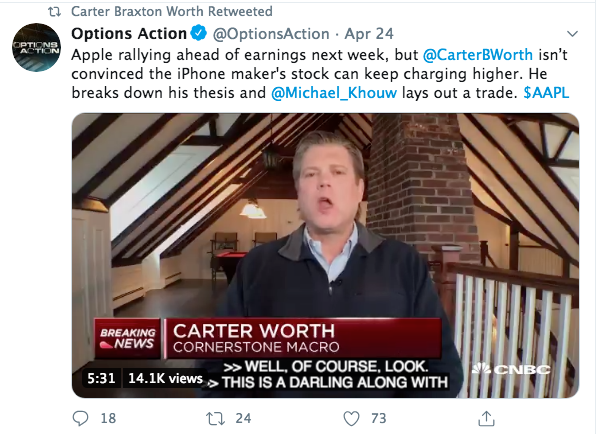
Are Apple (AAPL) shares higher in price than they were on April 24th of this year? Yes, we understand yet another one of Carter’s many errors. Just opinions though folks, these are just the prevailing opinions put forth within and/or under the CNBC programming.
Example #3
MarketWatch is another financial media resource that highlights analysts, strategists and fund manager opinions and/or forecasts on the market. In attempt to NOT fear-monger, it sometimes proves beneficial to highlight the fears of market participants in efforts to assuage such concerns. For each leg higher in the market, new fears proliferate. To the befuddlement of the bears, this is exactly what creates the “wall of worry”, which the market seemingly enjoys overcoming. Recall from the first days of May 2020, the following from former Goldman Sachs analyst Will Meade:
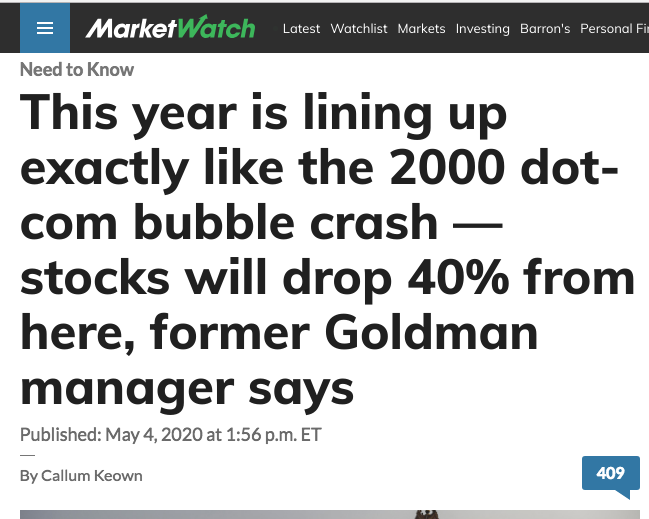
Will Meade: “The Nasdaq in 2000 did a similar bear market bounce as stocks this year — dropped 40%, then bounced 42% off the bottom retracing 61.8% of its drop. It stalled then fell 43%, making a new low four months later. There is a presidential election on the horizon, as it was in 2000, creating further risk and uncertainty, while retail participation and leverage was near the 2000 bubble level.“
On May 4th the S&P 500 was trading just above 2,800. Had you sold based on the offering from Will Meade… need I say more?
Example #4
After a market route in Q4 2018, whereby the S&P 500 fell into the 2,300 range, one would think the Morgan Stanley analyst would have adjusted his market outlook and analytics to capture the Fed’s pivot, Chinese economic stimulus and the general resetting of earnings expectations. But that didn’t happen. Wilson stuck to his guns, urging on several occasions for market participants to “Get off the bull”, as the market rally persisted in late January 2019.
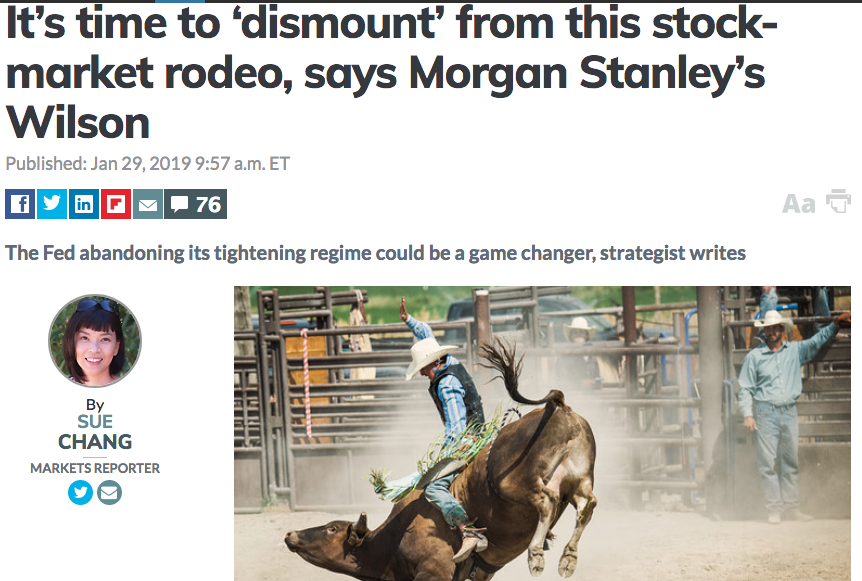
“Employing a rodeo metaphor, Wilson on Monday urged his clients to “dismount” as the market’s rally since late 2018 is starting to look precarious.
“Maybe the bull ride since Dec. 24 has not gone a full ‘8 seconds’ but we’d look to dismount anyway—we’re close enough and bulls can be dangerous animals,” he said in a report, referring to the number of seconds a bull rider is required to stay on to earn a score for a ride.
“We struggle to see the upside in hanging on just to see how long we can. We think it is better to hop off now and rest up for the next rodeo.”
It was only a couple of weeks later in February that Wilson doubled down on his warnings, sending out notes to clients urging them to accept that an earnings recession was at-hand.
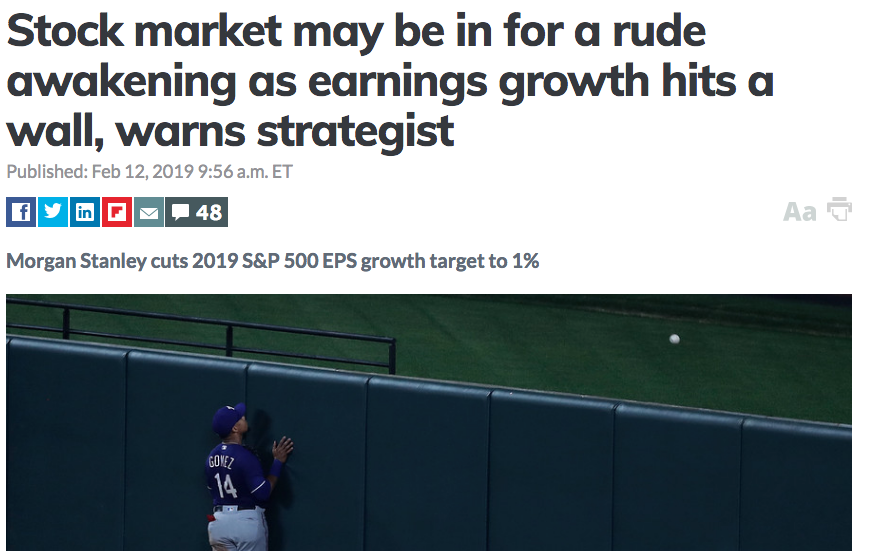
“Mike Wilson, chief equity strategist at Morgan Stanley, on Monday downgraded S&P 500’s earnings-per-share growth target for the year to 1% from 4.3% and warned of a looming earnings recession.
Our earnings recession call is playing out even faster than we expected,” said Wilson in a report. “When we made our call for a greater than 50% chance of an earnings recession this year, we thought it might take a bit longer for the evidence to build.”
“We have seen this kind of inflection happen a few times, but these inflections were all related to 1) comping against negative or slower EPS growth or 2) tax cuts mechanically lifting the growth rate. Neither of those forces is at play this year. In fact, it’s the opposite making the achievability of these estimates even more unlikely,” he said.
The strategist actually took it further and suggested that investors should brace for more downward revisions, higher volatility and increased pressure on returns.
“If current estimates move in line with history, we could see a full year decline of about 3.5% in S&P earnings,” said Wilson.
We’ve been following Mike Wilson’s works and market calls for the last several years. Wilson is almost always offsides with his market forecasts. In 2020, post the bear market bottom, the strategist has turned bullish. Although I’m often bullish on the market outlook, I don’t bias myself and forget Wilson’s misgivings over the years, and neither should you in my opinion. And then there is Twitter… Broad-based warning for anybody who chooses to align with a popular Twitter account.
It can prove a daunting task for many investors, as it pertains to resource building. By and large, the best advice I can give is to look for as many black and white facts and eliminate as many opinions on those facts as one can. And no, technical analysis is not always black and white. It is highly dependent on perspective as we demonstrated in our recent weekly Research Report, as follows:
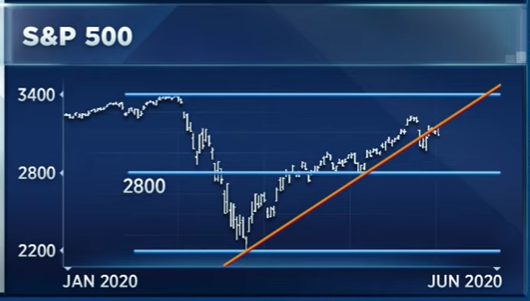
“One of the notable charts from 2 weeks ago (above) found a break in the S&P 500 trend-line, but only a minor break before recapturing it. Unfortunately, the trend-line did not hold this week and identifies a clean break below at the end of this past week.
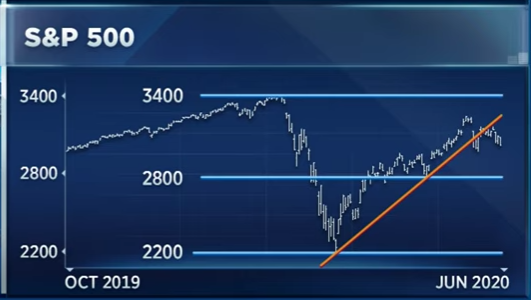
But, because there is always a but right? Should our trend-line begin at the March lows or the most recent low? Some might argue it should start at the ultimate low of the former bearish trend while others might argue that the chart should start at the former low from whence the new trend was first tested. If using the latter, the trend-line would start at the low in April and would look like this…
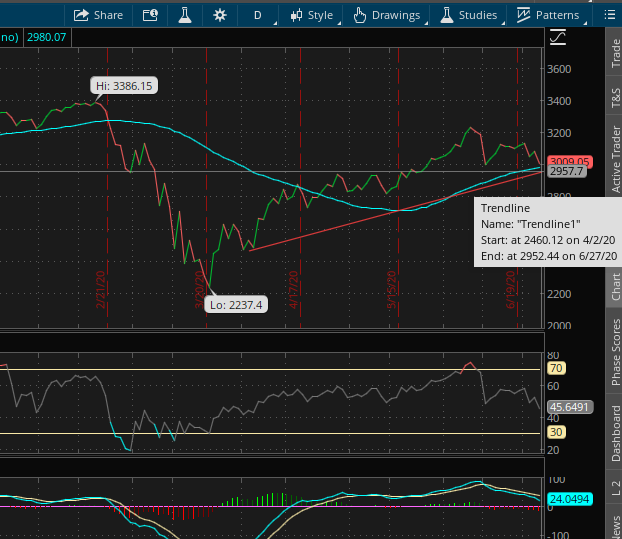
So if we start our trend-line from the April 2nd low, the support for the benchmark index would come in at 2,952 and not reveal a break of trend as of yet. Remember that technical analysis is little more than perspective, and clearly perspectives can change the outlook as identified in the exercise of where trend-lines begin and end.”
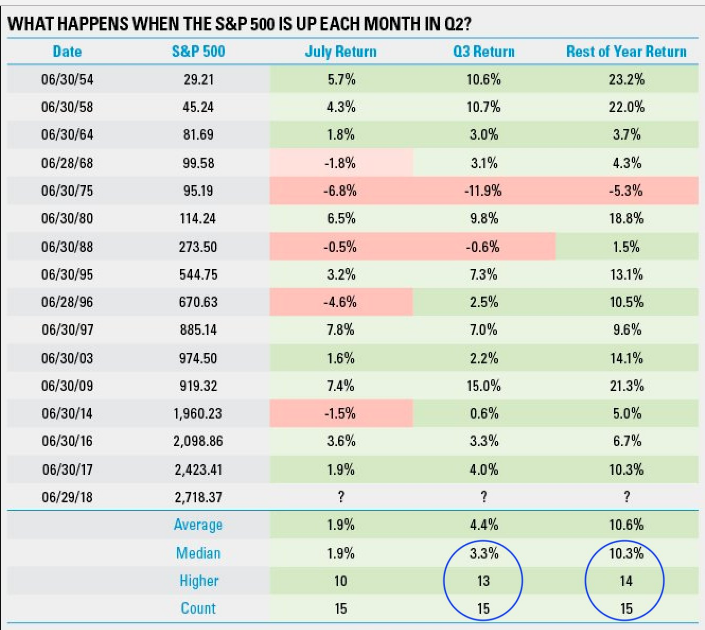
As we focus on resource building and recognizing the difference between facts and opinions, we hope you utilize finomgroup.com as a fact-driven resource going forward. In looking forward to another trading day, we enter the 1st trading day of the Q3 2020 period. With that, we look back on a rather strong Q2 2020 market performance.
Recall that in Q1 2020, the market was down 20 percent. Well, the S&P 500 was up ~20% in Q2, the best Q2 since 1938. It also proved the best quarter for the S&P 500 since 1998. Was there anyway to know that Q2 was going to be this strong? Again, here is where we rely on the history of the market and the statistical data. The Q1 2020 period was the worst in history for a Q1 period. Previous worst Q1 was in 1938 down 19.4 percent. The rest of the year the S&P 500 gained an incredible 54.6% to finish the year up 24.5 percent. So what can we expect now given the strength in Q2 that we should have anticipated as investors?
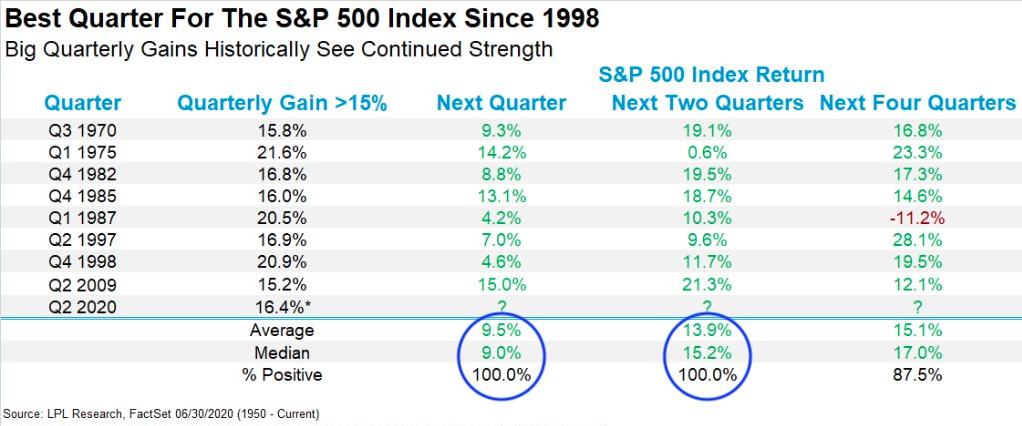
- Future returns after huge quarters (>15%) tend to see continued strength.
- Higher the next quarter 8 for 8.
While the permabear and naysayers will interject with, “Yea but we never had a pandemic like this” is a true statement in and of itself, for every bear market and/or recession there are unique circumstances. There was never a dotcom bust previously, never a 9-11 previously, never an oil embargo previously and never a Great Financial Crisis set of circumstances previously. The only thing different about the most recent bear market and/or recession are the circumstances, which is actually a constant difference. The one thing that does remain constant is human behaviors which are deduced by the market’s consistent recovery. And speaking of human behaviors being consistent, it would appear as though the 2009 Great Financial Crisis and bear market that concluded in March is playing out rather concisely in 2020.
Recall from our weekly Research a couple of weeks ago our following analysis on the present day consolidation period, which still persists and our commentary on the 2009 analogue for the S&P 500:
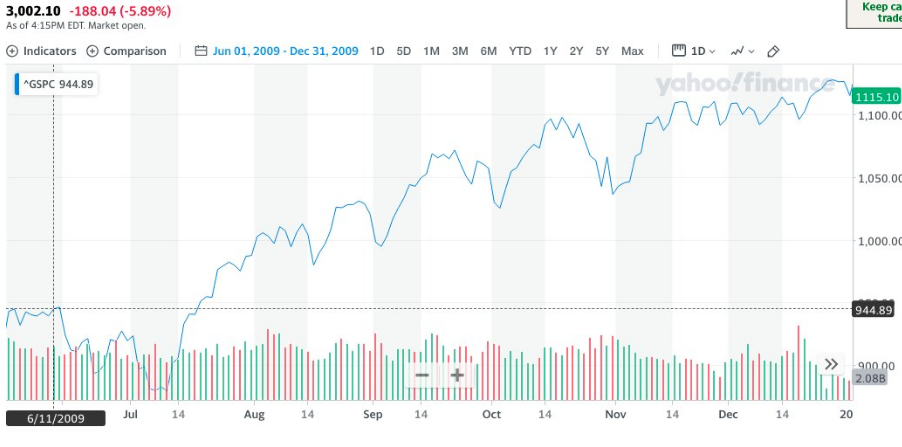
“I (Seth Golden) wish I could perform an artistry of predicting the week ahead or the depths of any additional corrective pattern. In truth, I’m no more certain that the ~5% pullback last week is all we’re going to receive from markets than if we receive a 10% consolidation wave that lasts from June 11th until July 10th, as it did in 2009. Thus far, the March 2009 bottom that led to a 43% rally has proven the best analogue for the current March 2020 bottom and subsequent 44%+ rally. But then from June 11th to July 10, 2009 the S&P 500 consolidated 9% of its rally. (Chart below)
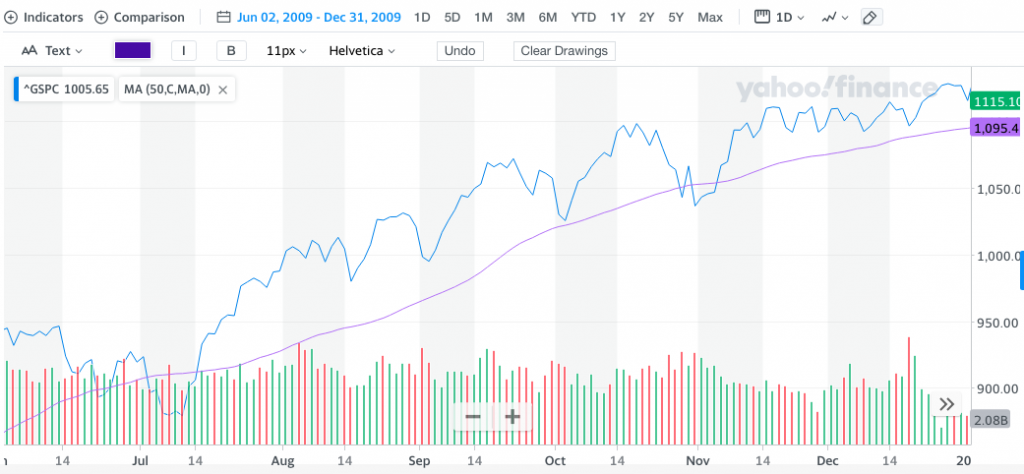
The pattern from July 2009, thereafter, sustained the newly formed bull market. Clearly there were pullbacks along the way, but they always resolved higher. Additionally, the chart below from the same 2009 time period shows how the S&P 500 traveled along the path of its 50-DMA.
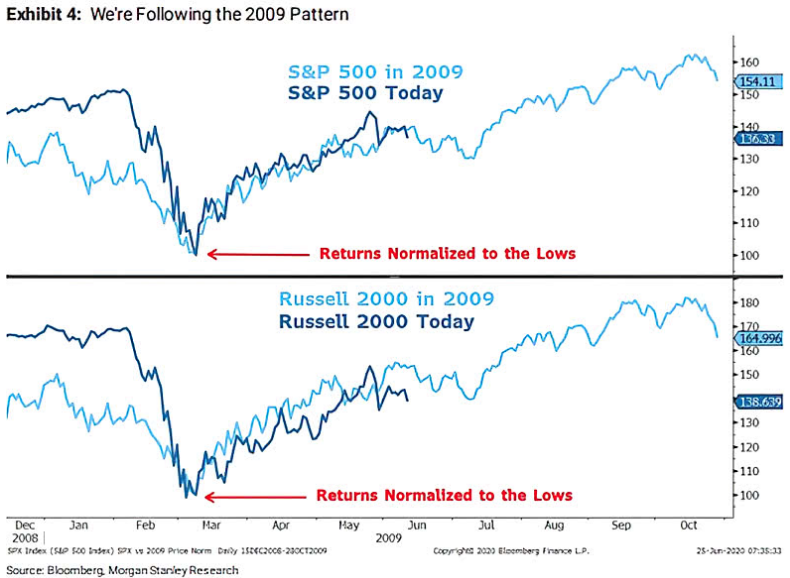
Despite the week-to-date strength in the S&P 500 and a strong close to the Q2 2020 period, we remain below the June 8th high, but off of the recent consolidation low of 2,965 just 2 weeks ago. But it looks like Mike Wilson of Morgan Stanley has finally caught on to our 2009 analogue narrative:
The Stock Trader’s Almanac is a strong resource for discerning between fact and opinion in the markets. It’s a collection of historical data about the markets. As it pertains to what we might expect for the first trading day of July 2020, I outline this tweet from Jeff Hirsch of the Stock Trader’s Almanac:
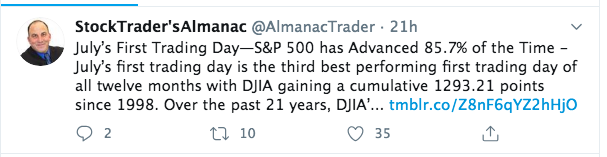
The gain may not be as robust as one things, but the probabilities of a gain do appear quite strong. I say this even as equity futures are tumbling, which further emphasizes that probabilities are not guarantees. The historical statistics on the market should be used as a tool, not defined to be a guarantee. With that being said, here’s another tool regarding what we might expect for the month of July and in the way of market returns from Bespoke Investment Group:
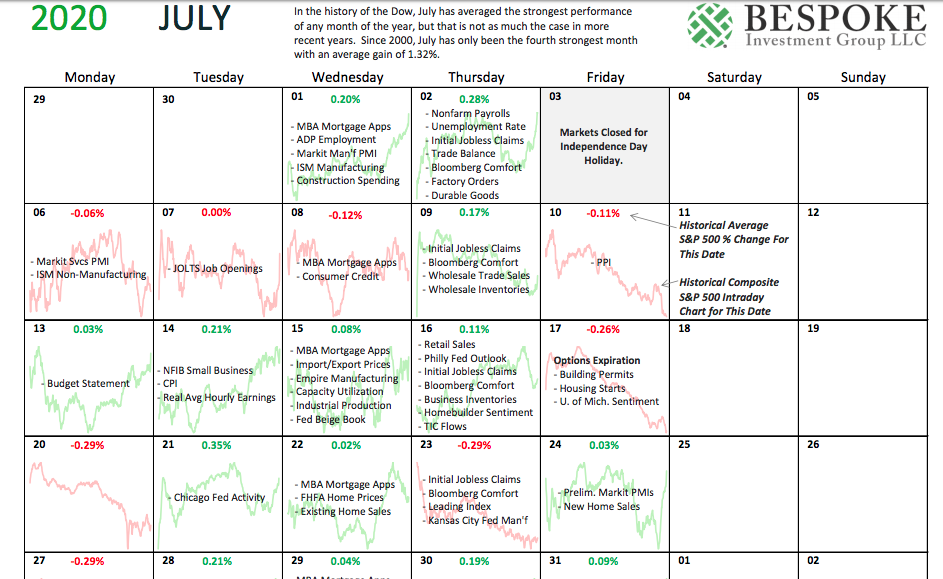
- In the history of the Dow, July has averaged the strongest performance of any month of the year, but that is not as much the case in more recent years.
- Since 2000, July has only been the fourth strongest month with an average gain of 1.32%
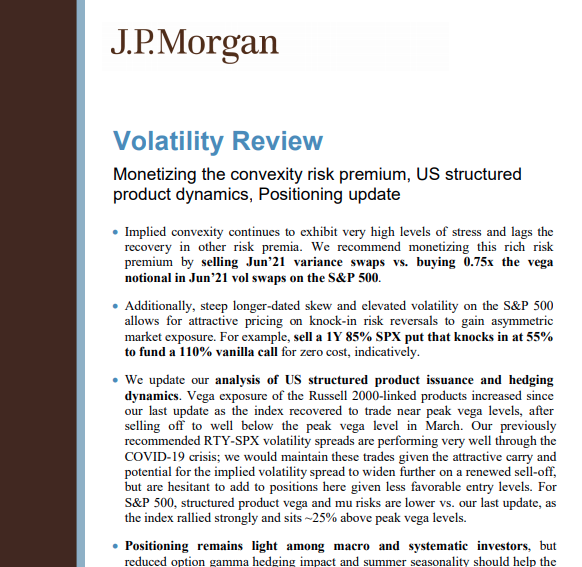
The S&P 500 will have a decent hole to climb out of once the market opens for the first trading day of the Q3 period, but J.P. Morgan’s chief quant strategist Marko Kolanovic cares little for the day and more for the year. In his most recent report, the analysts offers new highs for the S&P 500 by year’s end.
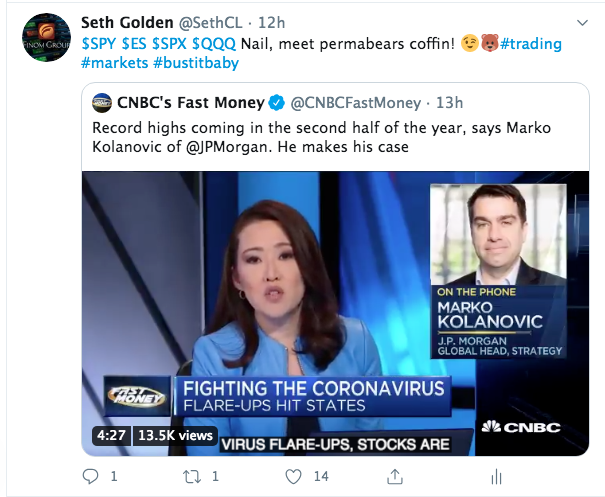
Unlike the commentary, analysis and opinions offered by many of his peers, Marko’s track record is quite stellar. But we could only recognize this by consistently monitoring and reviewing his works and interviews over the years for their efficacy/utility. Marko’s report will be sent out to finomgroup.com members tonight.
With that said, subscribe today and discover the facts each and every week that have helped our members become better investors!


