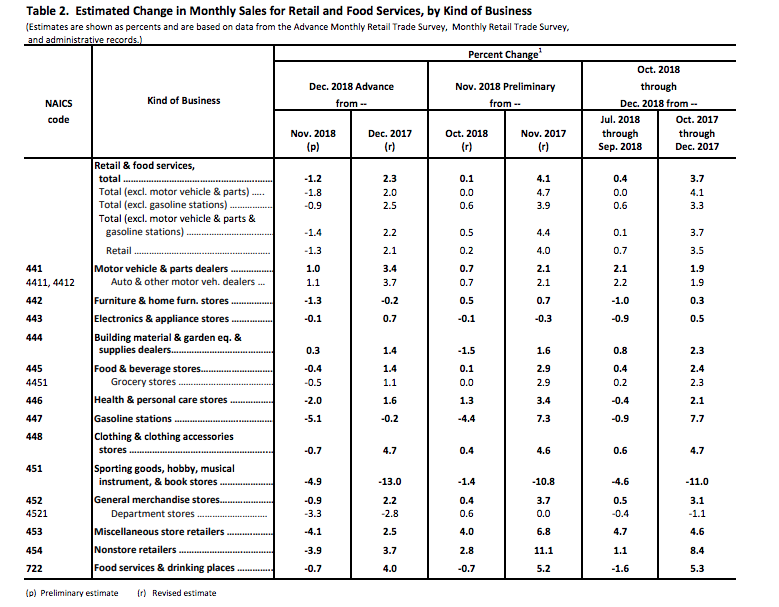
The market’s reaction to the release of the December 2018 monthly retail sales was just a reasonable excuse to pullback modestly on Thursday. December retail sales proved disappointing and missed average analysts’ estimates for a modest rise in the MoM data. For the month of December, the Census Bureau reported a MoM decline of 1.2%, with a rise of 2.3% year-over-year. The data was met with much conjecture as it proved to be the worst MoM dip in retail sales since 2009 and was delivered nearly 2 months late and due to the government shutdown. But within the report there seemed to also be a great deviation of trend as it pertains to Nonstore retail sales, which showed a decline of 3.9% MoM, something also not seen since the Great Financial Crisis and yet the economy isn’t or hasn’t produced any like conditions.
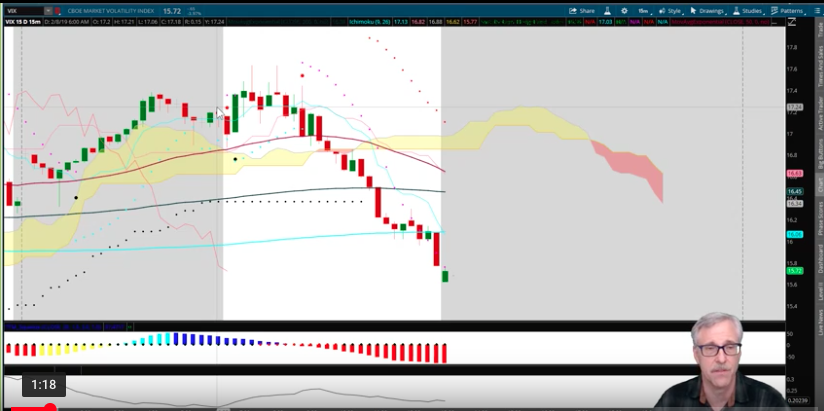
Within Finom Group’s weekly State of the Market (SOTM) video, Seth Golden dives deep into the monthly retail sales report, which we highly recommend viewing, as it will likely prove the only analysis available to market participants of its kind. Seth points to some red flags in the data that just don’t make logical sense. Within the weekly SOTM we also discuss our latest thoughts on market volatility and VIX Futures Term Structure, including how we are aiming for a near-term market pullback and uptick in market volatility.
Friday will be a modestly light economic data release day albeit with some important reflection points on the strength or weakness of the economy. After the latest dip in consumer confidence that coincided with a Q4 2018 market sell off and the longest ever government shutdown, investors desire to see an improvement in consumer sentiment in the 10:00 a.m. EST release of the Michigan Consumer Sentiment Survey results. While we have to await the latest reading on consumer sentiment, we can already take a look at the latest investor sentiment survey from The American Association of Individual Investors.
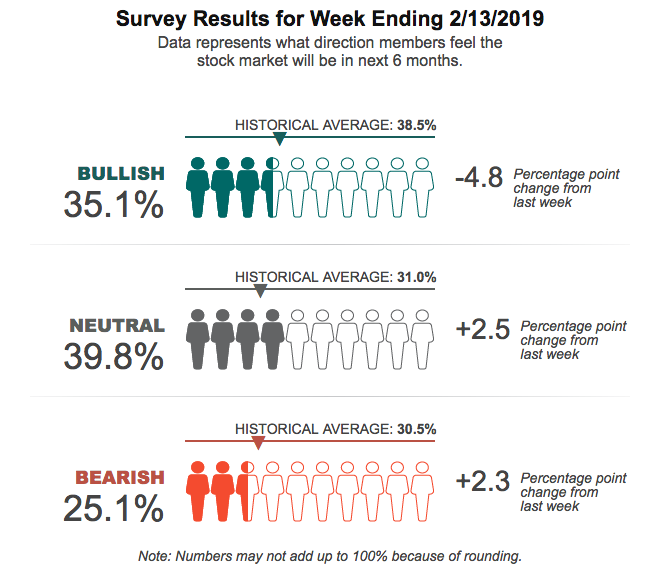
While the market has been behaving relatively well even with some of the latter economic data releases proving disappointing, the more recent fund flow and investor sentiment data may prove to foreshadow a future market pullback. This suggestion also accompanies the reality that the major indices and index ETFs have been holding within overbought territory for the last week and with the S&P 500 (SPX) closing above its 200-DMA recently. With that being said we now revisit the weekly expected move for the S&P 500.

Recall from Finom Group’s Weekly Research Report that the weekly expected move for the SPX was to be $41/points. Intra-week, we already achieved this move with options set to expire on Friday. The probability that the SPX will finish within the weekly expected move is high, given where we the index is week-to-date. Since SPX entered the week at 2,708, the upper bound of the weekly expected move would be 2,749, roughly $4/points higher than Thursday’s close. As such, we would be of the opinion, absent any major economic or geopolitical headlines, that 2,749 acts as a gravity point for much of the day and through options expiration. Of course, anything can happen on any given trading day (we miss football season).
Without any further ado, we now deliver our daily technical market recap whereby Wayne Nelson takes a look at the major indices and certain individual market movers on the day. Wayne offers some great insights on the indices and the latest filings from Berkshire Hathaway’s Warren Buffet and his reduction in Apple (AAPL) holdings. The video is 35 minutes in length