
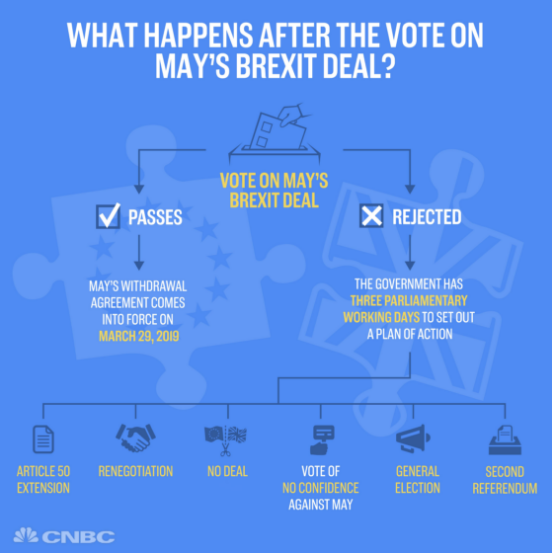
The two biggest stories from Tuesday’s market trading came from the late afternoon Brexit vote, which failed to pass, and Netflix (NFLIX) choosing to raise prices. The bill was rejected by 432 votes to 202. The 230-vote defeat is thought to be the largest in U.K. political history.
Following a controversial amendment, the U.K. government now has just three working days to map out a new plan of action. That means a new plan must be agreed with Europe and presented to U.K. lawmakers by the close of business on Monday January 21. May confirmed in Parliament that she would adhere to this. Amid the confusion there appears to be six potential outcomes, some of which could occur simultaneously.
While Prime Minister May has a tough negotiation and timeline to contend with, the real issue is that the EU’s lack of willingness to negotiate terms is the main obstacle. Remember, it is the U.K. that has voted to leave the EU. Essentially, EU officials have only agreed to a deal that is the equivalent to an old American saying/adage, “Go pound bricks”. The worst part about this situation for May is that parliament knows and recognizes the EU’s stance, but the various parties don’t care. They are essentially arguing for the sake of arguing, failing to pass on the current deal, which is the only deal the EU has stipulated and reiterated. In a sense, the U.K. finds itself in much the same scenario of the U.S. government, which is undergoing the longest shutdown in history, as there is no deal and futile negotiations.
Post the Brexit vote failure, U.S. equities maintained their uptrend and finished near their highs of the day and as the British Pound rallied. With all the concern for the Brexit vote, one thing was resolved on Tuesday… the Brexit vote. In short, while investors had concern over the vote, once the vote was brought forth the uncertainty was removed in favor of resolution. It wasn’t favorable resolution, but resolution nonetheless. But of course that is not why U.S. equities rallied.
Before the market opened on Tuesday, Netflix announced across the board price hikes, flexing its pricing power muscle. Going forward, Netflix will be charging $9 per month for its Basic plan, which provides access to one non-HD stream at a time, up from $8 previously. The popular Standard plan, which provides access to two simultaneous HD streams, is seeing its price rise by $2 to $13 per month. And the price of Netflix’s Premium plan, which provides access to 4 simultaneous HD and (when available) 4K streams, is rising by $2 to $16 per month. The price hike goes into effect immediately for new subs, and will hit existing subs over the next three months. It arrives fifteen months after Netflix hiked the price of its Standard plan by $1 per month, and the price of its Premium plan by $2 per month.
Shares of NFLX rose by 6.5% on Tuesday and lifted the entirety of the FANG complex. And why; well it all comes down to the subscription fee business model. If Netflix hit its Q4 subscriber guidance and its U.S. average revenue per paid sub rises by $1.75 per month due to the price hike, one would be looking at an extra $1.23 billion in annual revenue from the hike from its existing base, once it fully goes into effect.
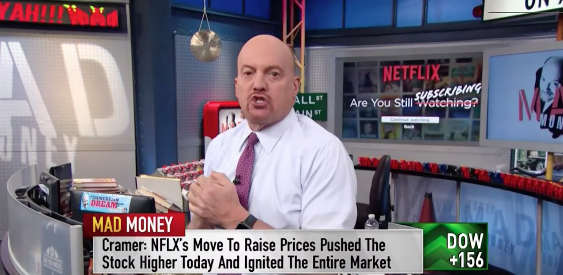
Mad Money host Jim Cramer discussed that the Netflix’s news was so big that it moved market ETFs that include the FANG stocks and he goes further to suggest that Amazon (AMZN) and Apple Inc. (AAPL) are undervalued based on the Netflix news. Cramer suggests that Amazon Prime could further increase its subscription fees, as it has done in the past and this doesn’t even consider the valuation of AWS-services. Apple service fees related to its music business segment and Apple care related services can also be boosted says Cramer. AAPL and AMZN both rose sharply on Tuesday and on the heels of the Netflix news. Last, but certainly not least, Citigroup has boosted its rating on all 4 FANG stocks and has gone all-in on them with a BUY rating as of Tuesday January 16, 2019.
Despite the 11% market rally off the bottom, since January 2, 2019, investors are almost as bearish about global profits as they were during the Great Financial Crisis. According to the Bank of Merrill Lynch Fund Managers’ Survey from January it finds investors with the gloomiest outlook on corporate profits since 2008. A net 52% of investors expect global profits to deteriorate over the next year, a “major reversal” from just 12 months ago when a net 39% saw profits improving.
The survey also saw the second-biggest two-month collapse on record in global inflation expectations, and the worst outlook on the global economy since July 2008, though just 14% of fund managers foresee a recession this year.
“Investors remain bearish, with growth and profit expectations plummeting this month,” said Michael Hartnett, chief investment strategist. “Even so, their diagnosis is secular stagnation, not a recession, as fund managers are pricing in a dovish Fed and steeper yield curve.”
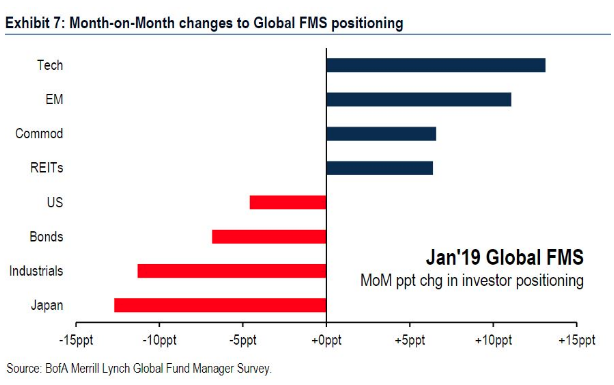
Based on fears of a global growth slowdown and earnings slowdown, investors are finding favor with emerging market, tech and commodity investments, as shown in the chart above. A global economic slowdown that results in lower if not flat earnings growth in 2019 remains to be seen, but the policy uncertainty underlying the global growth slowdown is apparent in many surveys. Man makes policy and given the policy uncertainty from around the world we are forced to recognize how man-made policies are also creating and have been creating man-made crises.
According to Torsten Sløk, chief international economist at Deutsche Bank Securities, one gauge of policy uncertainty is at a record, highlighted by the analyst in a Tuesday research note.

“Brexit, shutdown and trade war at the same time have triggered a significant rise in uncertainty. We are at the highest levels ever measured. The biggest problem for investors and central banks is that there seems to be no end in sight.”
Regardless of the headwinds facing investor confidence, fund flows have proven favorable of late. What this may have been signaling is that the worst of a potential global economic and earnings growth slowdown have been priced into the market. As such, equity investors have stepped in to buy perceived inexpensive if not cheap equities on the dip. Finom Group discussed fund flows with subscribers in our weekly research report, identifying the major fund flows from the previous week that seemed to have the potential for “lasting effect”.
“For the first week in twenty-nine, conventional fund (ex-ETF) investors were net purchasers of equity funds, injecting $4.4 billion (their largest weekly net inflows since June 20, 2018). Domestic equity funds, taking in a little less than $3.3 billion, witnessed their second weekly net inflows in three while posting a 3.99% return on average for the fund-flows week. Their nondomestic equity fund counterparts, posting a 4.08% return on average, witnessed their first weekly net inflows since September 19, 2018, (+$1.1 billion this past week). On the domestic equity side, fund investors embraced large-cap funds (+$2.5 billion net) and mid-cap funds (+$458 million), while on the nondomestic equity side investors were net purchasers of international equity funds (+$1.4 billion).”
In addition to more favorable fund flows, the so-called “smart money” is suggesting that investors should have been buying the dip. While this could turn on a dime, the trend over the last 12 trading days has been for the market to decline in the early hours and find the market bought into the close of the trading day. This is a change from what happened in December and a sign that the “smart money” could be backing this market comeback.
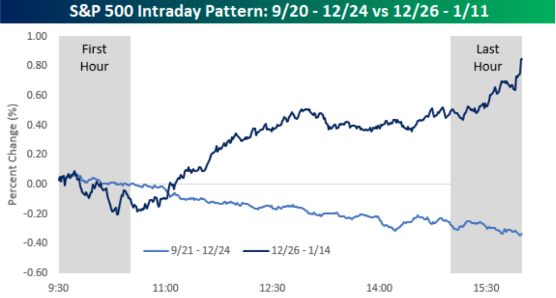
The indicator suggests that the more measured “smart money” investors tend to trade in the last hour of a given trading day after digesting the price action, while the emotional “dumb money” often trades in the first hour, reacting hastily to news events. The technical indicator was invented in the 1990s by money manager Don Hayes.
“From late September through Christmas Eve, the S&P 500 tended to open near the unchanged level but then drift lower throughout the trading session finishing near its lows of the day. Since Christmas, though, it’s been nearly the exact opposite,” Paul Hickey, co-founder of Bespoke.”
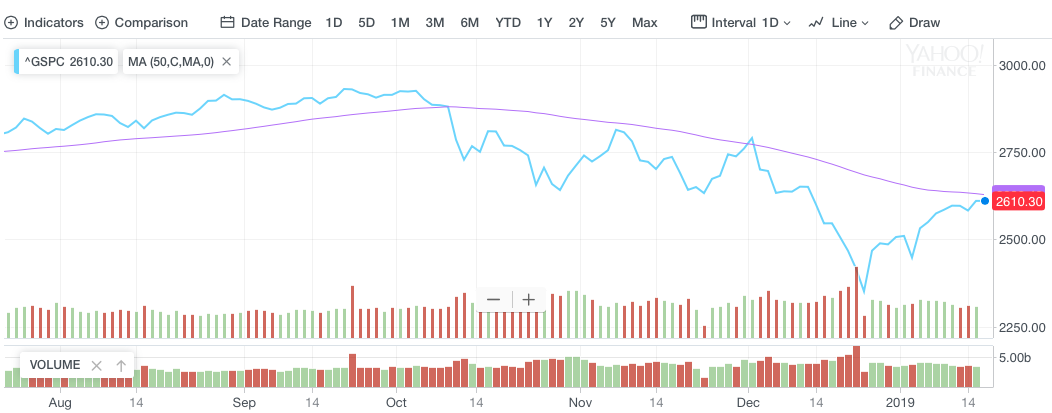
As we often discuss the headwinds and tailwinds for U.S. equity markets, we can’t help but to feel as though the current market rally will ultimately have a pullback. From where and how deep of a pullback remains to be seen. Finom Group is not of the opinion that the market will express the technical V-shape move off the December for reasons often discussed in our daily market dispatch articles. At present, however, the market has pushed above S&P 500 (SPX) resistance levels found at $2,575-2,581. As of Tuesday, the S&P 500 has also closed above a key Fibonacci .681-level at 2,600 and to close at roughly 2,610. The next overhead resistance level lay at roughly 2,628, represented by the 50-dma.
With the U.S. government shutdown completing its 4th week and seemingly with no end in sight, we can’t help but to think that the market rally is “whistling past the graveyard”. On Tuesday, the Trump administration now estimates that the cost of the government shutdown will be twice as steep as originally forecast. The original estimate that the partial shutdown would subtract 0.1 percentage point from growth every two weeks has now been doubled to a 0.1 percentage point subtraction every week, according to an official who asked not to be named. If the shutdown lasts the rest of this month, it could subtract a sizable half a percentage point from gross domestic product, the official said.
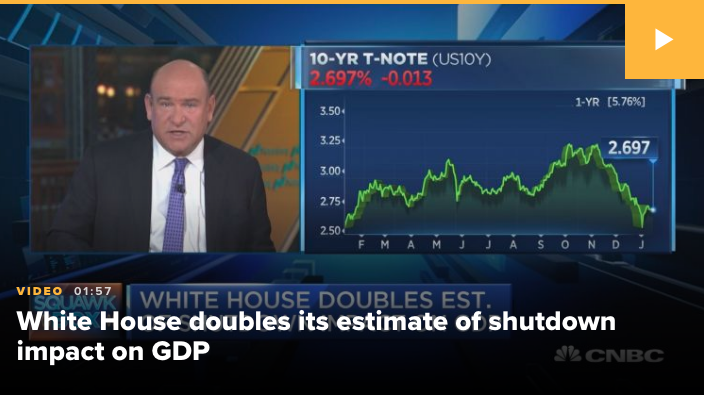
Mark Zandi, chief economist at Moody’s Analytics, forecasts a half a percentage point hit to GDP if the shutdown lasts through March.
“We estimate (the shutdown) will reduce first quarter real GDP growth by approximately 0.5 percentage points,” Zandi wrote in a research report. “Of this, about half will be due to the lost hours of government workers, and the other half to hit the rest of the economy.” Zandi said his estimate could worsen if the administration can’t continue to triage the effects of the shutdown or if the administration can’t issue tax refunds.”
The headlines surrounding the cost of the government shutdown to the economy will likely continue to proliferate unfavorably and until the government reopens. Moreover, the shutdown comes during an earnings season that finds bank/financials results rather mixed and with misses for individual reporting banks on either the top or bottom line. By all accounts, lending is slowing but credit quality continues to improve and the transmission mechanism that drives the economy remains in good health. We are certainly not experiencing any financial crisis level conditions that the market seemed to be pricing in during the December 2018 period. Nonetheless, the earnings season as defined by the banks that have reported to date has not proven to deter concerns for earnings and revenue going forward.
Ahead of the U.S. market open on Wall Street Wednesday, both Bank of America (BAC) and Goldman Sachs (GS) will report quarterly results. Equity futures are flat in the 6:00 a.m. EST hour with European indices mixed in the early trading hours. U.S. Treasury yields are largely higher. Crude oil is modestly lower, but soared on Tuesday.
Stabilizing oil prices have proven favorable for equity markets and the EIA just came out with its SHORT-TERM ENERGY OUTLOOK on Tuesday. (See chart below)
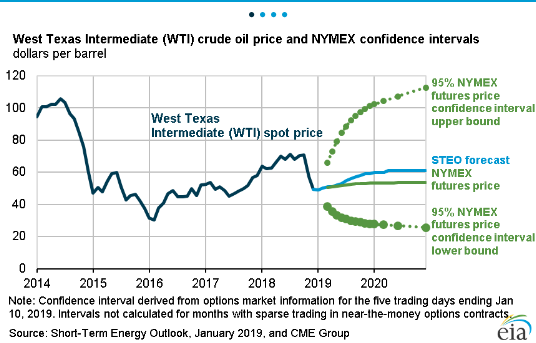
EIA forecasts Brent prices will average $61 per barrel (b) in 2019 and $65/b in 2020. In 2018, Brent prices averaged $71/b. EIA expects West Texas Intermediate (WTI) crude oil prices will average $8/b lower than Brent prices in the first quarter of 2019 before the discount gradually falls to $4/b in the fourth quarter of 2019 and throughout 2020. EIA’s forecast for the average WTI price for December 2019 of $59/b should be considered in the context of NYMEX futures and option contract values for December 2019 delivery. NYMEX trading during the five-day period ending January 10, 2019, suggest that a range of $28/b to $101/b encompasses the market expectation for December 2019 WTI prices at the 95% confidence level.
Trade carefully folks and with equity indices poised for a flat to lower open, we’ll see if the smart money comes in yet again to boost the markets toward the S&P 500 50-dma. Happy trading and subscribe today to access our weekly research reports and daily/weekly trade alerts.


