
The Grand Market Sell-Off: Is that what we’ll be calling the pullback in the indexes in the coming weeks? Most obviously it remains to be seen, but one thing is for sure, this pullback was well overdue. The Dow Jones Industrial Average fell mightily on Friday to cap an ugly week and after a meteoric rise in January. The Dow finished off about 665.75 points, or about 2.5%, to lose the 26,000 handle. The point decline for the Dow marked its worst since December of 2008, when it tumbled 680 points. However, the percentage decline was only the worst drop since June 24, 2016, when the gauge fell 3.4% during the Brexit dramatics. More broadly, the S&P 500 index fell 2.1% at 2,761, while the Nasdaq Composite index finished down 2% at 7,240 on Friday. The Dow and S&P 500 fell 4.1 percent and 3.9 percent, respectively, for the week, while the Nasdaq lost 3.53 percent. Pointswise, the Dow lost 1,096 points this week.
The S&P 500 may look to bounce off the 50-day moving average, which is around 2,716 or another 2% lower and remains to be seen. There’s broad consensus that Friday’s market sell-off, which was also felt in European markets and bears witnessing in Asian markets, is a result of the reflation in bond yields. The 10-year yield has been on a steady climb in 2018.
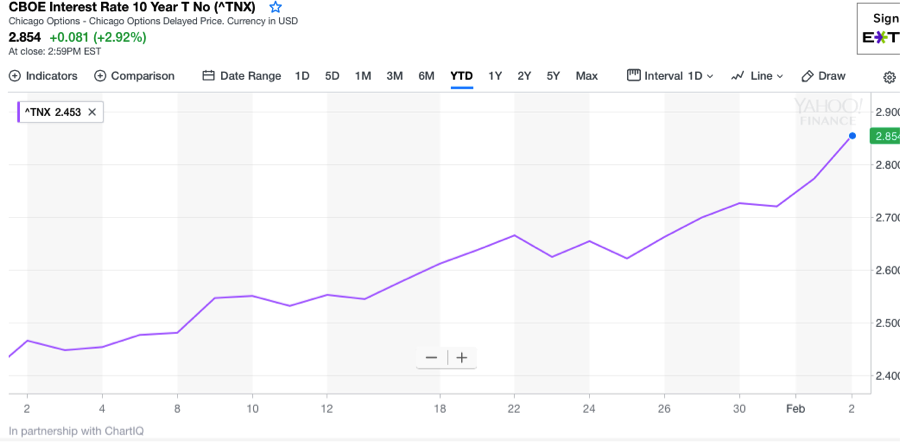
The chart depicted is of the year-to-date rise in rates. It’s not the rise itself that spooks equity markets; it’s the rapidity for which it rises. Essentially the equity market desires to reflect a rise in rates through asset allocation. Even with the 10-year Treasury still yielding less than that of the S&P 500, portfolio and fund managers expand the consideration for the full year. As such, they price in the prospects for continued yield increases, but to the extent the rates rise quickly the asset reallocation process as becomes expedited. But the big picture is much more important than the one month of rising yields we’ve experienced in 2018.
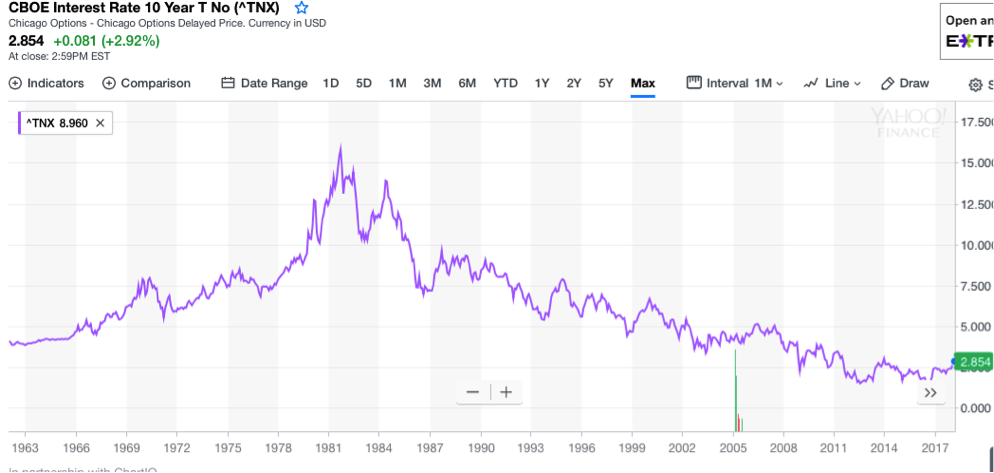
The chart above depicts the maximum 10-year yield chart, dated back to the 19,60s. The term inflation has always befuddled me with regards to bond yields and interest rates. Why? Well because it simply doesn’t exist in practicality. Bond yields, long-term only go in one direction as an adverse affect of leverage and/or credit in a monetary based societal system. It’s for that reason that we’ve become more accustomed to the term reflation.
The causation of the Friday and weekly sell-off remain as a point of speculation. It’s simply human nature to seek out reason for a market sell-off, but finding validation is far more difficult. While it makes sense that yields rising gives cover for portfolio managers to deleverage from equities and into less risky assets, it’s just as easy to suggest that the release of the Nunes Russia Probe memo spirited the market sell-off. After all, this was a deliverable to the public on the gaping day in the markets. Furthermore, it’s even easier to suggest that the markets became way overextended and ran out of steam. Good news became bad news, as strong economic data produced nothing more than down market days. And more recently we seen the Dow, S&P 500 and Nasdaq all have outside-reversal days. These were warning signs that serve as a precursor to a market pullback are they not?
Usually the loudest voice gets the most attention and in truth the loudest voice has been the commentary on the 10–year yield. So if we’re going to huddle around the media mass message manifesting, then we should pay attention, as it can become a self-fulfilling prophecy.
Besides the 10-year rate rising throughout January, the latest Nonfarm payroll report did anything but quell reflation fears. While the labor report beat expectations for job growth and held a steady 4.1% unemployment rate, the wage growth proved the most important metric in the report. Wage growth spiked 2.9% in January, the fastest pace of wage growth in 8 years. And with that, the reflation trade manifested itself on Friday, sending bond yields higher and equity prices lower.
The Dow losing grip on 26,000 and the S&P losing 2,800 level on Friday, and the way the indexes did so, added up to a significant spike in the VIX. The VIX spiked to its highest level since 2016 and, surpassing the previous record set in December 2017. VIX options also traded at their highest volume ever on February 2nd, surpassing the previous record set in December 2017.
The CBOE reported the transacting of over 4.3mm VIX options on Friday. This on a day where the VIX finished higher by 28.5% to 17.31. The VIX came into 2018 with a reading of just over 10 and is now up some 75% since January 2nd. It begs the question, “how much higher can the VIX run in such a short period?” There is no opinion in the matter however; every VIX spike results in a subsequent crashing of the VIX. This is a product of how equity markets function or find homeostasis. Again, there is no opinion in the matter, markets cannot function with persistently rising volatility and as such the powers that be always provide the markets with tranquility over time. This is not to suggest equity markets cannot fall further and from the closing levels found on February 2nd, but more importantly they can do so in a less volatile fashion.
Every VIX spike, like that during Friday’s trading session, is the initial reaction to the .SPX options trading, which tends to also coincide with an outsized move for the S&P 500 . Options volumes being what they were Friday found sharp moves in the VIX and S&P 500. After VIX spikes and S&P 500 outsized moves, the market tends to resume more normalized volumes which can still produce declines in the major averages, but less .SPX option trading volume and VIX option volumes tend to produce a divergence of the VIX from the major averages. We saw such an occurrence when .SPX Jan 31 options expired. It’s one of the reasons history has shown that the VIX has an 80% negative correlation to the S&P 500 and why VIX spikes tend to relax rather quickly. Most VIX spikes last for less than a month while very few have ever lasted for more than a couple of months.
The unfortunate aspect of the VIX itself is that it is uniquely correlated to .SPX options and as such a completely reactive…metric reading on the level of fear or complacency in the markets. As such it defies technical analysis, as most professionals understand. That is not to say one can’t simply look at a chart and make sweeping claims, most do, but on any given day and for any given reason, the VIX can react and defy perceived conclusive technical analysis. The major averages losing 2+ percent Friday and the VIX spiking 28.5% was not the end of the world; it was simply long overdue and a healthy sell-off at that. But in the moment, yes, it can feel and seem to be much more than that.
With the VIX now reading greater than 17% and up strongly on Friday, this has put VIX Futures term structure into backwardation for the second time in the trading week. What is backwardation, for those who haven’t experience with the subject matter? Backwardation is said to be occurring when the Spot Price of the underlying is greater than the Futures Price at a particular point in time. At present or as of February 2, 2018, Spot VIX was higher than VIX Futures contracts as depicted in the graphic below:
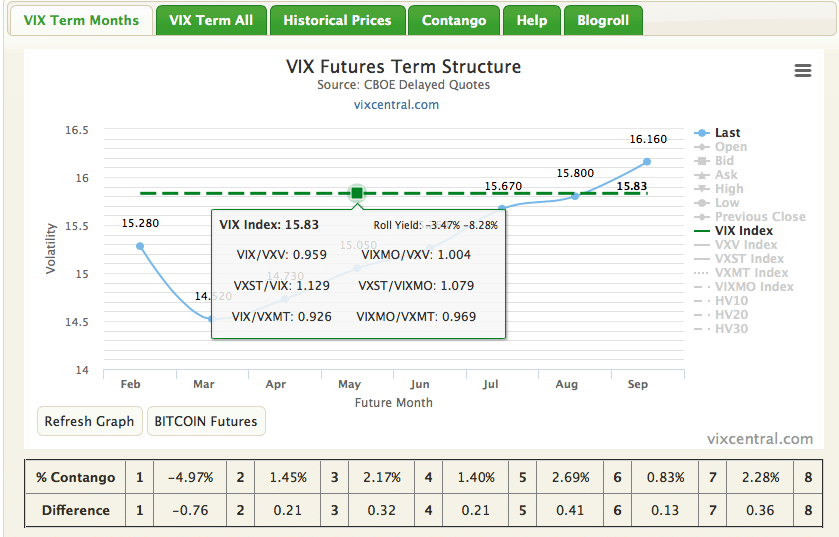
M1, the front month Futures contract, is in backwardation. At expiration of the VIX Futures contract, the implied move of the contract price will converge onto the Spot VIX price i.e. move higher in price. It’s not a perfect convergence of price assimilation to be clear. Backwardation does not occur frequently in the Volatility complex based on the natural order of market cyclicality being more predisposed to bullishness than bearishness. In fact, VIX futures are found in backwardation less than 10% of the time. For this reason, commodities are largely exampled when depicting backwardation.
The vast majority of time VIX Futures are in contango, which results in an upward sloping VIX Futures curve. We could get deeper into contango and backwardation, but the broad strokes paint the picture quite well and lead to one precise conclusion: In the near term, backwardation will revert to contango and the VIX will be found relaxing. It may not happen Monday, Tuesday, Wednesday…but it will happen in short order.
On another point, somewhat related and somewhat unrelated, the breadth and volume of .SPX options are largely being fulfilled with the more recent spike in the VIX and pullback of roughly 4% for the major averages. S&P 500 options were up roughly 40% in January and versus the same period a year ago. Protection was purchased in excess and in case of a market pullback. That market pullback has/is coming to fruition. As such, the market activity we’re experiencing is normal, rational and will more than likely continue to follow the trajectory of corporate earnings for the bulk of 2018. In short, the markets and complacency simply got ahead of themselves and as such the markets are simply buying time for the next leg higher. Again, that next leg up is aligned with the expected growth in corporate earnings. That’s, historically and inarguably, how markets work. The trajectory of corporate earnings has always defined the course for equity markets.
Going into next week it’s quite probable that Monday will find U.S. equities under more selling pressure and after global markets react to the U.S. sell-off. The selling pressure is not likely to be a mirror of February 2nd, but to a lesser degree. It’s very rare that “markets bottom on a Friday”. Additionally, it is likely that equity markets find stability midweek and in preparation for a future leg higher in the market that may also be preceded by some sideways market activity. That’s actually the ideal case for short-VOL participants, sideways action that leads to an equity market rise.
The selling pressure on February 2nd gave way to a good deal of fear in the market as represented in the 28.5% move higher in the VIX. It also gave way to doomsdayer market commentary on the whole. “This is the big one, the crash is upon us, a 20% decline is coming and the Fed has lost all control”. Quite literally, this type of commentary is put forth for every single, outsized market daily decline of significance. They are always found in error until they are not, but they are only not found in error when corporate earnings are declining. The other more compelling narrative painted by doomsdayers is the one that promotes charts of the 2008 crash and the dotcom bubble bursting through 2001. Of course we can’t forget their Black Swan warnings and promoting. They poke fun at market bulls, suggesting what all doomsdayers suggest that being, “Where was your crystal ball when the dotcom bubble burst and during the financial crisis.” Truth be told, market bulls or any investor for that matter doesn’t need a crystal ball, they just need to study corporate earnings.
Many doomsdayers and market pundits like to suggest the financial crises that culminated in late 2008 was unforeseeable and therefore unpredictable and unmanageable. But it’s as far from the truth as it could be. Prior to the financial, real estate and equity market collapse, corporate earnings were declining every single month and for more than a year. The same can be said for the period from December 2000-late 2002. Corporate earnings always define where the market is going in the not too distant future. Now let’s look at a more recent depiction of corporate earnings since 2016 as offered below:
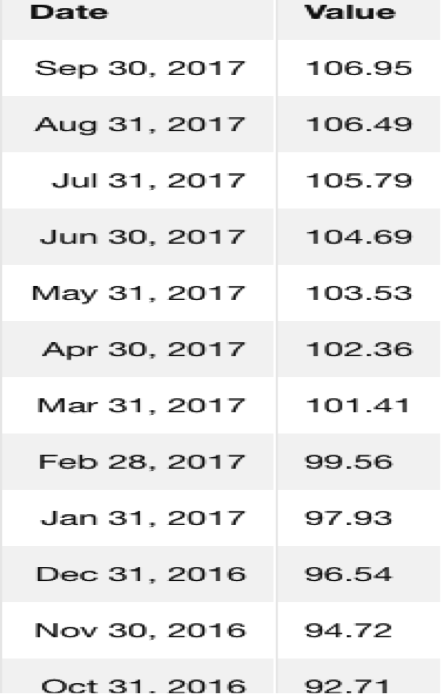
For all those bears fighting against the market and laying claims to poor market fundamentals…what are they talking about? Well, what they are likely talking about is the reasons behind the earnings growth. Credit rising to astounding levels, corporate share repurchase programs and low interest rates yielding to poor consumer debt: equity ratios. While those are certainly factors boosting corporate earnings, that’s still the end result. What investors follow, corporate earnings, not causation of corporate earnings. It’s the difference between knowing the whys and participating with the whys in the market. In conclusion, corporate earnings are fine and the equity markets will be fine with time and post a healthy market pullback. If you have prudently planned for this inevitable pullback and have cash on the sidelines, just be a little more patient. You’re prudent planning will pay off.
This article is a condensed version of our full length report found here and part of finomgroup.com’s subscription service. Have a great Super Bowl Sunday!


