
Remember the bear market? It wasn’t so very long ago and maybe the question is fitting given its short life cycle? Markets have moved at an accelerated pace to the upside since March 23rd, marking the bottom of a 33-day long bear market. The accelerated pace can be correlated to the rapidity of fiscal and monetary policy implementation, while the ever-increasing rate of algorithmic trading has also played its role in the rapidity of market moves.
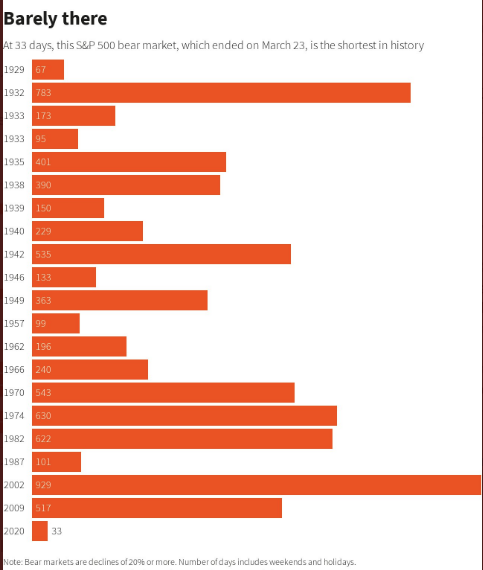
Regardless, it proved the fastest/shortest bear market in history. This likely found a vast majority of investors sidelined with disbelief and as the market has rallied sharply, validating a new bull market has taken shape. While we can make the argument that the new bull market was cemented by firing a breadth thrust in the first week of June, others might argue that the Golden Cross in mid-July was the proverbial “nail in the coffin” of the bear market.
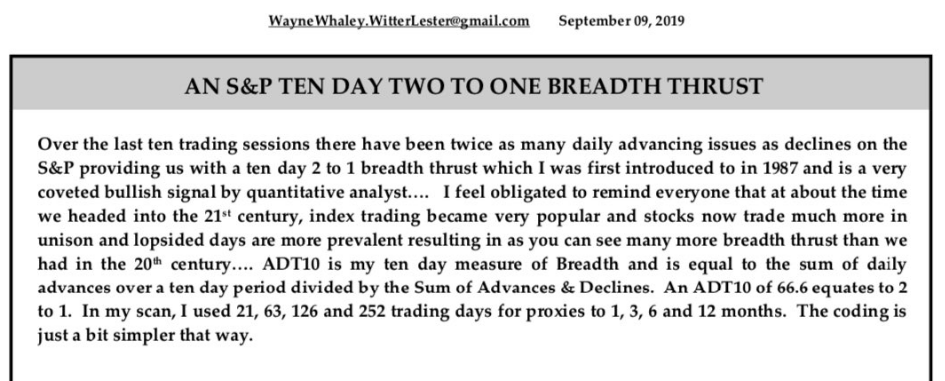
With respect to breadth thrusts, the vast population of investors/traders WILL NOT recognize the power of a breadth thrust. For clarity, a Break Away Momentum (BAM) breadth thrust executed in June. This found the market with an interim top on Monday June 8th and before a 5-day price corrective period, and further time consolidation that last through all of June. Referring to the power of a breadth thrust, however, what it can and has often done in the past, is to render technical analysis at the index level far less effective than most care to accept. Breadth thrusts tend to be why the markets achieve an accelerant of gains, become more overbought with an already present trend proving that much more extended. Below are our notes, statistics and definitions for Break Away Momentum breadth thrust we offered in our Research Report on June 7, 2020:
- The first breadth thrust is called a Break Away Momentum breadth thrust or BAM. (Walter Deemer)
- Break away momentum occurs when 10-day total advances on the NYSE are greater than 1.97 times ten-day total NYSE declines. It is a relatively uncommon phenomenon, occurring only 23 times since World War II (an average of once every 3 1/2 years). Cyclical bull markets, though, are traditionally heralded by break away momentum
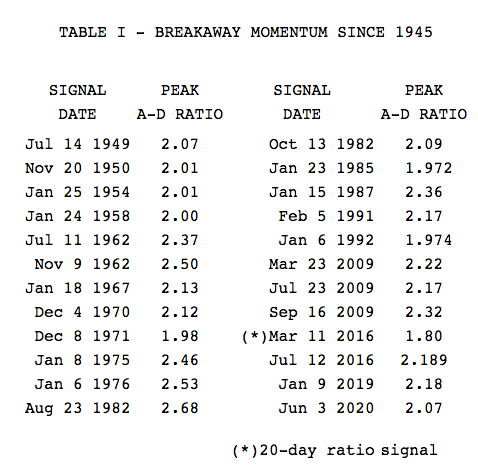
- Post-BAM declines/corrections tend to be surprisingly brief and shallow given the amplitude of the BAM-generating advance.
- When the train leaves the station it doesn’t back up to let late-comers get aboard.
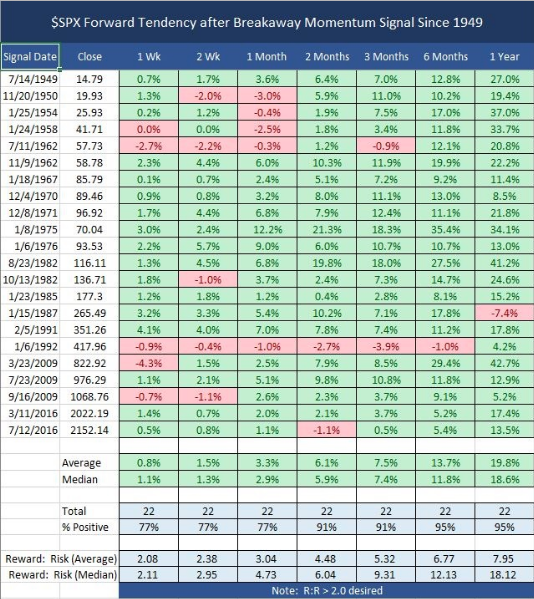
Breadth thrusts tend to be warning signals for those whom are bearish and positioned against the bullish market trend. They tend to also prove a warning signal for those attempting to find interim tops in markets by way of Equity Put/Call ratios and other sentiment indicators. The breadth thrust don’t necessarily have to correlate with positive fund flows, but they do tend to accompany increased fund manager leverage. Have we seen that since the first week of June and during the extended rally? As disseminated in this past weekend’s Research Report, we certainly have!
To delve deeper into this subject manner of professional money manager leverage and how it correlates to the S&P 500, we look at the NAAIM weekly data!
As with most sentiment indicators, the NAAIM Exposure Index is a contrarian indicator. A high net long position is bearish for the stock market. This is because this category of operators has already gone long during the uptrend. Having said that, the NAAIM Exposure Index is not predictive because many active managers aim to limit risks and losses. These subjects will rarely go against the market, but will follow the price trend. So in a bull market, you will rarely see active managers short selling against the trend. Many or almost all will align with the dominant direction. Now let’s look at the latest reporting from NAAIM.
NAAIM members, who manage money for a living, are the most bullish since mid-June 2018. This week’s 101.20 reading was up 6.65 points week-over-week and has been trending higher since June 2020. Readings over 100 are quite rare. In its 737-week history, there have been 12 other times when the index crossed 100.
The NAAIM Exposure Index has only broken above 100 for the 8th time in its short history. The top panel chart below is of the S&P 500 and the bottom panel is of the NAAIM.

As we can see, given the 7 previous times NAAIM had been 100 or greater, 2 times the market advanced near-term and 5 times the market consolidated near-term. The more capital exposure to the market, once something proves to drive fearfulness, the greater the likelihood that some of this exposure will be curtailed. Based on the NAAIM’s present reading, if nothing else, we might expect some form of market consolidation. Like anything else that drives the market, however, consolidation demands a catalyst of sorts.
Another measure of market leverage was recently outlined in the July BofAML Fund Manager Survey.
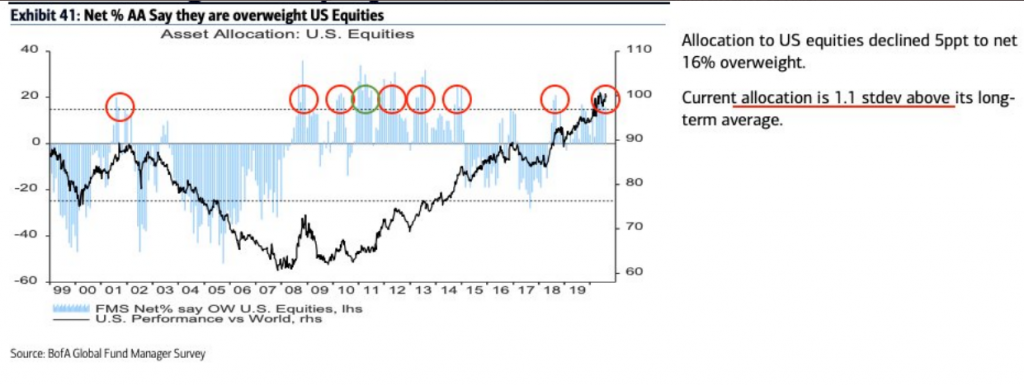
As we can see from the survey chart above, leverage has increased since the March bottom, but declined in the month of July. Nonetheless, fund manager leverage remains 1.1 stdev. above its long-term average.
We mentioned earlier that higher market leverage tends to correlate with breadth thrusts. In the NAIIM chart above, however, you might notice that the NAAIM readings above 100 in 2013 and 2014 don’t correspond with a BAM breadth thrust occurring that year. So what gives? The answer: More than one breadth thrust fired this past June, which also fired in 2013 and 2014. Again, we refer to our June 7th Research Report as follows:
“Then came Friday and on Friday a Whaley Breadth thrust was “fired”. The breadth thrust came on the heels of an unforeseen and un-forecasted May Nonfarm Payroll growth report which showed some 2.5mm jobs were added in the month of May. The forecast was for a decline of roughly -8mm.”
...with respect to the Whaley Breadth Thrust that was triggered on Friday, here are some definitions below:
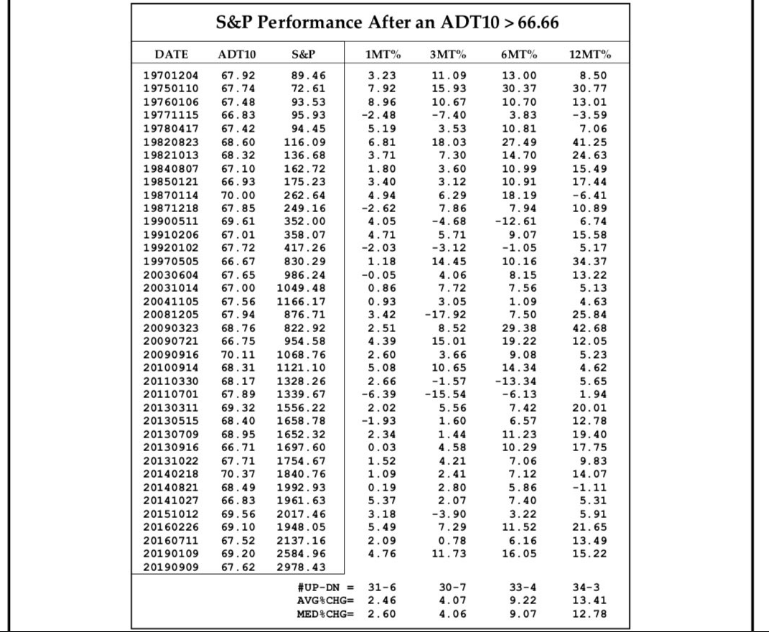
As shown in the Whaley Breadth Thrust table of occurrences above, 2013 and 2014 both show up. We can also see the breadth thrust firing in 2016 that supported the market recovery that year, which ultimately led to a mid-year BAM breadth thrust firing, lending support to the continuation of the rally through year’s end and into 2017. One of the reasons I bring these breadth thrusts to the forefront of the market conversation, and as new record highs in the Nasdaq (COMPQ) and S&P 500 (SPX) were achieved on Tuesday, is that most market participants forget about the staying power of breadth thrusts, discount them shortly after executing. Market participants continue to exercise their routine technical and fundamental analysis/works, as if they hold unfettered efficacy after breadth thrusts fire, BUT THEY DONT! I also offer this commentary as analysts and strategists continue to beat the “market can’t go much higher” drum in perpetuity.
Matt Maley of Miller Tabak is one such lead market strategist that has maintained an unhealthy and undisciplined stance on the market’s trend and probabilities since May.
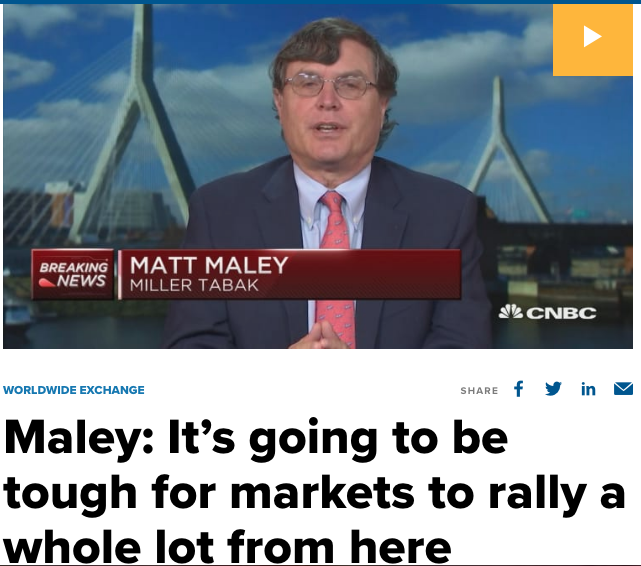
Obviously, the market had a very strong month of May, after already putting in a 10%+ gain for the month of April, just after the bear market concluded. (Hindsight is 2020. See what I did there) If at first you don’t succeed, try-try-again, as they say and as Matt Maley certainly tried in mid-June.
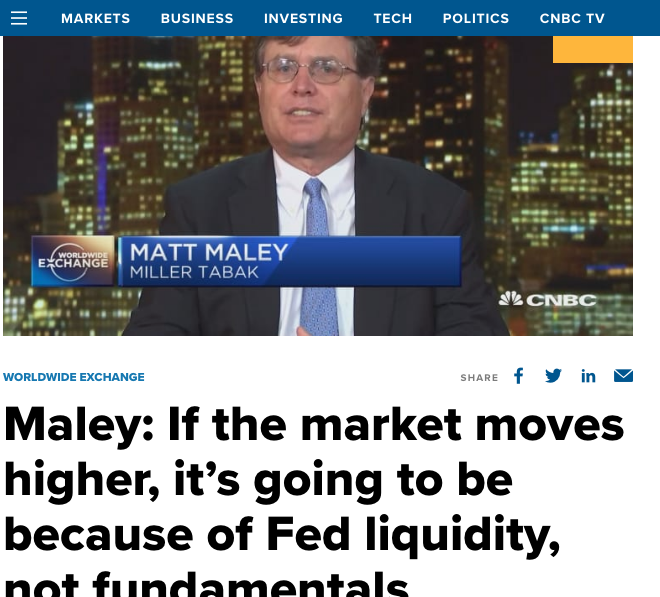
And why not blame the Fed for your errand forecast offered in May, right? Way to go Maley! In all honesty, we recognize the sentimental equity market boost from the Fed’s bond buying and other credit market activities. Nonetheless, this was a “known” back in May, so… I guess the sooo… is to just continue to beat the bearish drum, ignore the breadth thrusts and allow your clients to miss out on a now 4+-month rally in the major indices. In Maley’s latest narrative, he’s calling for at least a 10% market correction, but this time he’s offering some optimism on the other side of that correction. It’s a barbell approach to analysis that likely also proves a capitulation on his part. Here is Matt Maley’s latest notes outlined via MarketWatch:
“Away from the bull camp is Miller Tabak + Co.’s lead strategist Matthew Maley, who sees equities ripe for a near-term fall of 10% to 15%. An overbought stock market, notably within megacap technology stocks, uncertainty over a new stimulus plan, U.S.-China relations, and fears over an autumn pandemic wave should make investors uneasy, he says.
- “raise cash now” to take advantage of the next fall, and maximize profits in the rally later this year.
- Those who followed our suggestions in Jan/Feb were very happy when March and April came around…and we think they’ll be very happy over the next two months as well if they follow the same strategy.
- The Fed’s number one concern is the credit markets, not the stock market. Only a severe decline in stocks would destabilize the credit markets, not a 10%-15% correction.
So, he expects the Fed will turn the spigots back open when that correction threatens to get more ugly, such as was seen in the first quarter. That could “lead the S&P to rally toward 3,600, but we also believe that will be very tough for the stock market to rally THAT strongly without experiencing a normal/healthy correction beforehand,” says Maley.
I’m not here to suggest Maley’s latest bearish call will be proven right or wrong. Frankly, I don’t care what he has to offer at this point as it proves of little consideration to Finom Group Premium and MasterMind Options members. We recognized the market bottom, have been trading through the 4 consecutive monthly gains and building strong returns. At this point, we’re in position to benefit from either outcome; a market correction or a continuation of the uptrend, with intermittent points of consolidation (3-7% pullbacks). Our monthly, completed trades are below:
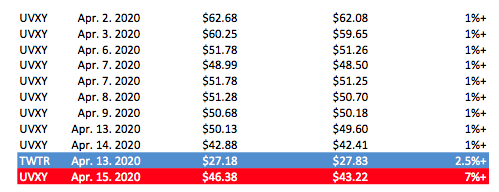
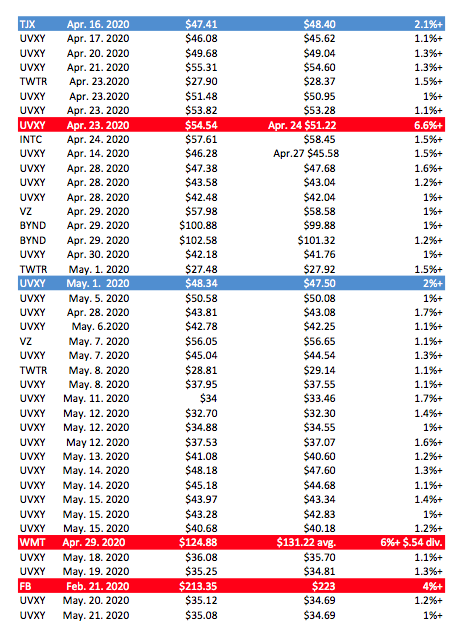
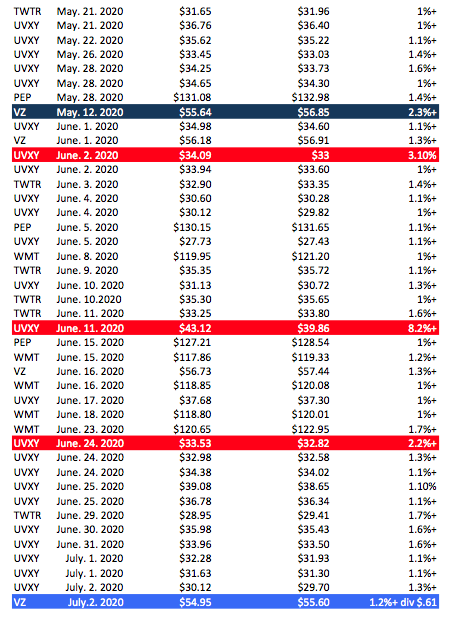

After a peak in the VIX back in March, we’ve been shorting implied volatility by way of VIX-ETPs, recognizing what historically takes place at market bottoms and VIX peaks. At this point, we do expect some degree of normal market consolidation, which is in fitting with our long-standing recognition of 2020’s alignment to the 2009 market bottom and new bull market analogue. We discussed this outlook as well in our Research Report:
“Often times, when the index revisits a lower trend line a third time within a short period, it identifies that investors are uncomfortable with higher prices and or valuations. If the supportive trend line breaks, the index would look for the next level of support. This is where we would be looking for the 50-DMA to lend the next level of market support. This would also coincide with the 2009-analogue.“
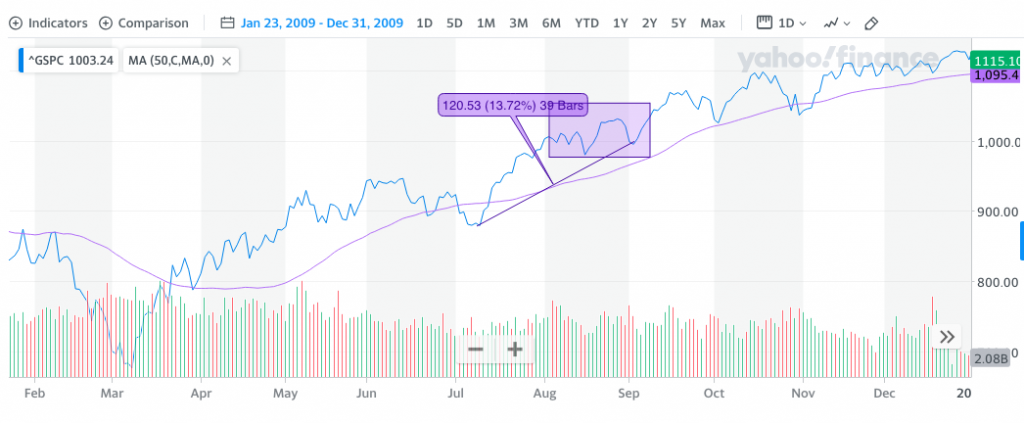
As shown in the chart of the 2009 S&P 500 analogue above, the start of the coming week did prove to produce higher highs and consolidation that lasted until the first week of September.”
We’ve got our new bull market highs folks! Will consolidation take shape from here? It should also be recognizes that consolidation can take two forms: Price and time! We may simply go sideways from here with lower and higher prices and consolidate more so in time than price. That is largely what took place through the month of June. The key point here is to simply remain flexible and open to a wide range of outcomes. While we are certainly living through unprecedented circumstances, human behavior remains relatively consistent. Now let’s look at some historical data; after all, we just made new all-time highs!
Taking a step back for just a moment and possibly to the dismay of many market strategist and pundits, let’s recognize the gains in each month since April. What happened when the S&P 500 was up in April, May, June, and July (like 2020)?
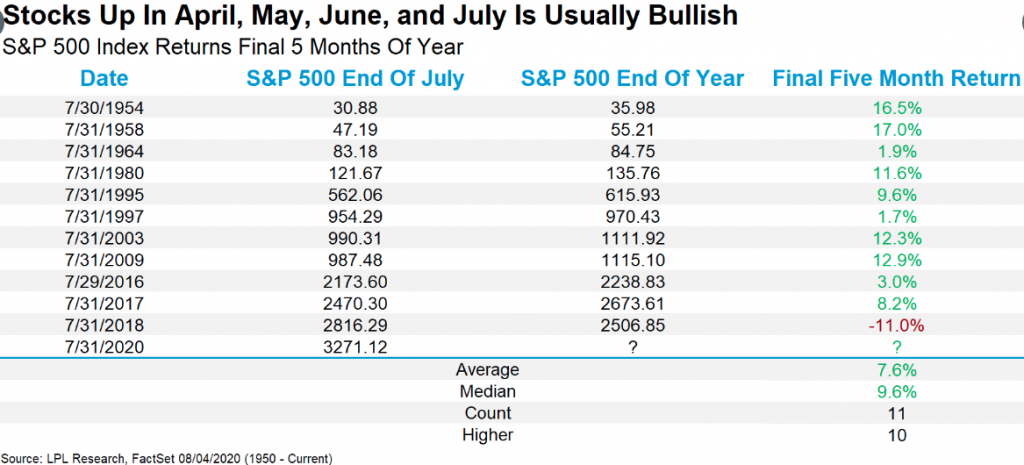
The final 5 months finished higher 10 of 11 times, with 2018 being the only one that didn’t work. What happened in 2018? The Fed outlined its rate path, indicating future rate hikes and an “autopilot” comment that markets found rather unsavory seeing how the housing market was in a year-long decline as mortgage rates soared. All of this while the Fed was also tightening financial conditions through asset sales, deleveraging its balance sheet.
The new S&P 500 record high is now 3,395.06, set Tuesday morning. This is ~2 points higher than the former high set in February of this year. Believe it or not, many investors/traders find themselves thinking that this will prove a double-top and a precipitous decline is set to ensue, even a market crash. But that’s not what history tells us and isn’t fitting with longer-term, recognized market outcomes.
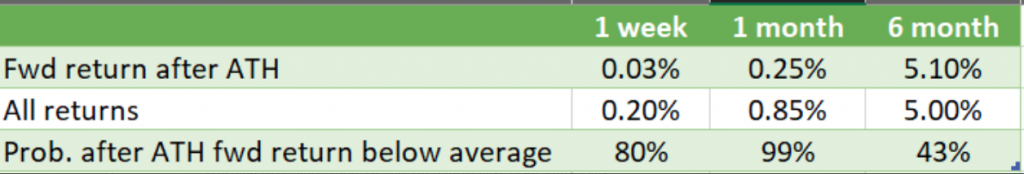
- SPX after reaching all-time highs (ATH).
- Since 1980 1-week and 1-month returns have been statistically lower than average after ATH is reached( but 6m higher).
- -1w, 1m Returns are still positive so usually if you go flat after ATH you fall behind.
The data is pretty darn clear folks, gains beget more gains. It typically takes an exogenous event to interrupt said gains. We had such an exogenous event in February, which halted the markets’ trend. Nonetheless, it took just 126 days to get to levels never seen before. For context, the median number of days between all-time highs for the S&P 500 is 90. This is a horrible year by most measures in society and the economy, and yet fairly run of the mill for the stock market, at least using this metric.

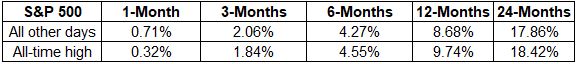
The statistical market performance after all-time highs aren’t overwhelmingly optimistic, they simply suggest more highs are to come. As such, let’s look at the data a little more deeply and in recognition of folks likely looking to take profits. Here is what Michael Batnick rendered from the historical data across 1 and 3-month time frames.
“Looking out over 1 and 3-month periods, stocks actually do show worse returns on average, after hitting an all-time high versus all other days. So, if you’re a short-term trader, then maybe it does make sense to lock in gains, as long as you’re using a tax-deferred vehicle. Probably not, but maybe.
If you’re not a short-term trader, then you’ll see that all-time highs are nothing to fear. Returns are actually higher 6, 12, and 24 months out. This isn’t a shocking revelation. Rising prices attracts buyers, it’s that simple.”
The difference in the 1-month and 6-month returns in the first table vs. the second table is the dividend inclusion. Let’s not overlook those gains, regardless! And here are some more interesting stats for those who might be confused about the S&P 500 making new all-time highs while the VIX is above 20.
The reality is that this has happened before, quite a few times.
- SPX has made 578 new all-time highs since 1990
- VIX average 14.48 on those days
- 70 times VIX closed over 20
- Highest VIX close on a record SPX day was 26.25 in January 1999.
- 11/27/1998 1/8/1999 1/29/1999 3/18/1999 4/12/1999 5/13/1999
- 6 Months of new highs before VIX < 20:
- 7/1/1999 first day < 20 close.
Earlier in today’s narrative, I recognized the proliferating algorithmic trading paradigm that has increased in scale since 2009. Finom Group largely recognized the probability of a new all-time high back in June, but reissued our outlook for new highs more recently, given market symmetry dynamics and algorithmic trading operations:
“THE ALGORITHMS HAVE AN AGENDA: NEW RECORD LEVELS! Done and done, as they say!
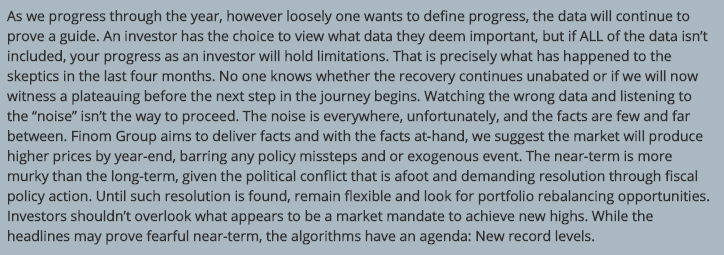
We entered a new bull market to end the month of May in my opinion, but this is just part of an elongated secular bull market with intermittent cyclical bear markets. After declaring a new bull market on May 31, 2020, I have limited concerns over a double-dip recession, but remain open-minded, given the economy still demands fiscal and monetary relief/support.

Without policy support, risks to my longer-term forecast remain aligned with a policy misstep. Having said that, a secular bull market is most probable given the markets’ ability to demand and achieve such appropriate policy implementation. In speaking of a secular bull market, FundStrat’s Tom Lee offered the following commentary on Tuesday and with market’s achieving new highs:
FUNDSTRAT: “The Long-term trend cycle backdrop remains bullish through 2020 well into 2021 and likely 2022.”
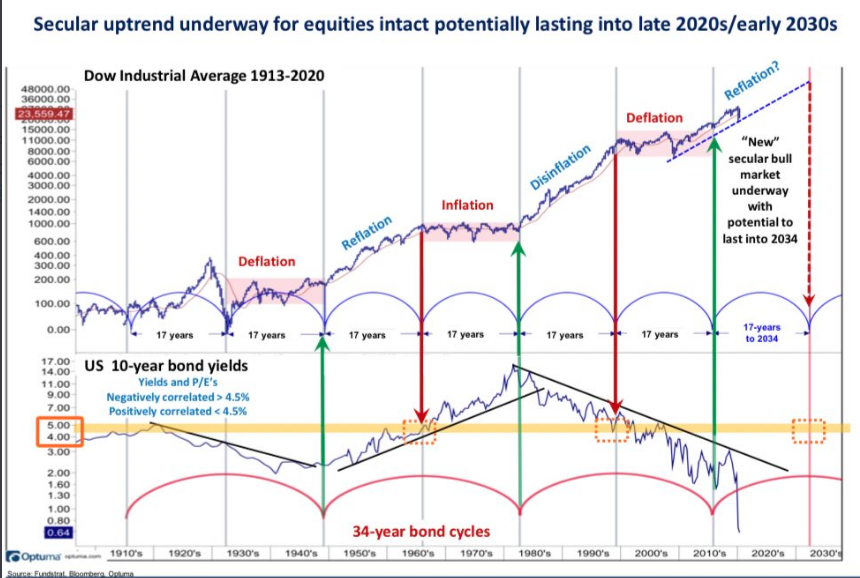
Most have been slow to align with the new bull market within a 10-20-year secular bull market. With each monthly gain, however, they are slowly increasing their belief and releveraging their portfolios. Also in the latest BofAML Fund Manager survey we find there are more fund managers that believe this is more than just a bear market rally.
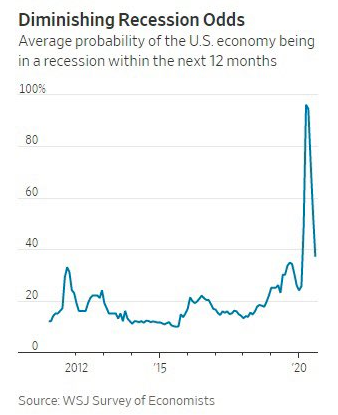
Funny how price changes sentiment isn’t it? The economy has only been reopened from the pandemic shut-down for ~2 months and even sentiment surrounding the economic cycle has shifted. Economists surveyed by The Wall Street Journal see an average 37% probability that the U.S. will be in recession within the next year. This is down from 54.5% in July & 73.5% in June.
I’m not here to paint some rosy picture for investors. These remain unprecedented times and we still have yet to come an election cycle that may prove turbulent. Nonetheless, I think we have seen the worst of times in both the economy and markets, for the cycle at least. We’re learning to live with the virus, as the world awaits a vaccine approval from the FDA. Whether we look at the economic data or market trend, however, one thing is very clear…
… things are far less bad, and improving as evidenced by the economic and Covid-19 data that proliferates daily and weekly. What we can’t find ourselves doing, as investors/traders, is living by narratives and avoiding the data, historic or otherwise. Latching onto narratives about the economy, about COVID-19, about policies and the election are not where you want to be as an investor/trader. It’s one thing to recognize there position in the overall scope of financial media headlines, but the market doesn’t follow media headlines and is always forward-looking. Many investors/traders are blinded by the headlines, the narratives. As such, I reiterate what we disseminated to finomgroup.com members over the weekend:

“What went wrong and what could go wrong is an easy subject to focus on and what most investors highlight in dialogue and in their portfolio actions or inactions. What could go right is harder and it is the reason why people don’t bother to take the time to look around at the entire situation. Unfortunately, most investors engage the market with eyes wide shut, not eyes wide open! Let’s be sure we’re finishing out 2020 with eyes wide open folks!”


